Company: Stanbic IBTC
Rating: Hold
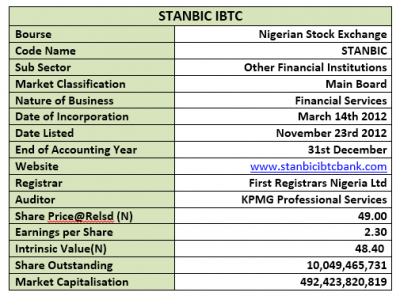
Current Market Price: N49.00
Fair Value: N48.40
By: Jeariogbe Tunde Segun (Equity Analyst)
Key Financial Tickers:
• This report examines the first three months financial activities of Stanbic IBTC in 2018. For clarity and growth reasons, comparisons were made to similar performance in the first quarter of 2017
• Observation show that the financial institution holds the record of outstandingly building its first quarter performance over comparable years and this year is not an exception.
• Our estimates are based on 10.049 billion shares outstanding in 2017 as compared to 10 billion in Q1-2017. The increased was due to investors taking advantage of the company’s policy of converting cash dividend to shares. Please note that the policy is still effective until year 2020.
• The bank took advantage of the Central Bank of Nigeria (CBN) waiver allowing banks to write-off fully provisioned loans in 2016 financial year. Notwithstanding, its continued asset quality pressure saw the bank’s gross Non-Performing Loan (NPL) ratio rise to 7.2% as at third quarter of 2017 financials.
Brief History
• Stanbic commenced its Nigerian operations in 1989 and legally became a member of the Standard Bank Group (SBG), this was after the merger of Stanbic Bank Limited and IBTC Chartered Bank Plc during the banking consolidation era when banks in Nigeria were required to have N25bn minimum capital base.
• In line with another CBN regulation, Stanbic IBTC adopted a holding company structure in 2012,
• The bank which is the main brand of the group was then delisted from the official list of the Nigerian Stock Exchange, having being licensed as a national commercial bank, transferring most of its subsidiaries to the Holdco and then re-listed as Stanbic IBTC Holding Company.
• Currently, Stanbic IBTC has two wholly owned subsidiaries, namely: Stanbic IBTC Nominees Limited and Stanbic IBTC Bureau De Change Limited
Corporate Figures
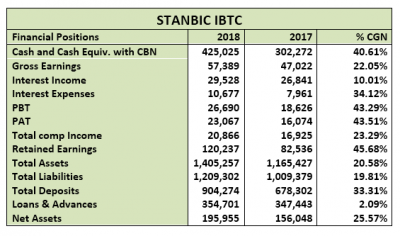
• Gross Earnings for the period under consideration grew by 22.05% over comparable period of 2017, moving from N47.02 billion in 2017 to the current N57.38 billion
• Interest Income improved by 10.01% from N26.84 billion to N29.52 billion.
• Both Profit before and after Tax respectively appreciated over similar period of 2017 by 43.29% and 43.51%.
• Generally, we scored the financial institution’s performances high, considering the achieved growth over the last three-month performance (2017)
• Confirming the Asset composition, it was noticed that:
Total Assets improved by 20.58% to N1.405 billion as against N1.165 billion in the first quarter of 2017.
This could be linked to the sound inflow of deposit between the two periods under comparison. Note that total deposit improved by 33.31% over Q1-2017 deposits
As a result cash and other liquid Assets improved over the comparable year of 2017
Liquidity/Risk Ratios
• The share price of Stanbic IBTC is theoretically less volatile than the market. In our opinion, this could be linked to the high fair value it is selling on the floor of the exchange. Traders are likely considering cheaper equities while those currently in it will prefer to hold.
• Although a financial institution, it currently runs a fair Debt to Equity ratio of 28.19%, which is slightly above the industry average of 23.87%.

Profitability Ratios
• The amount reported as Interest Expense is same as 18.60% of the Gross Earnings figure, which is 9.89% over the 16.93% estimated in similar period of 2017.
• Profit before Tax (PBT) Margin improved by 20.29% over same period of 2017. As can be seen from the below table PBT is 43.57% of the Gross Earnings figures
• Similarly, Profit after Tax equally stood above 2017 by 17.58% as the margin between the profit for the year and the Gross Earnings is currently estimated at 40.19% as against the previous 34.18%
• In other words, 59.81 of the Gross Earnings were used to take care of various expenses during the three months currently being analysed.

Efficiency Ratios
• Gross Earnings to Total Assets ratio was stable through the two periods under comparison in this report. The Gross Earnings is currently estimated at 4.08% of the Total Assets against the 4.03% for last year
• Gross Earnings to Equity was also fairly stable having reduced marginally to 29.29% from the 30.13% estimated in Q1-2017 figures.
• Going by the Financial Leverage of 7.17x, it can be safely concluded that the financial institution has used more debt in acquiring additional assets. Please note that the index only dropped by 3.98% below the estimates in the similar period of 2017
• Considering the inherent risk in the operating environment, the bank seems to have adopted a cautious approach towards creation of risk assets as the Loan & Advances only grew by 2.09% over the comparable period of 2017.
• Establishing the above fact further is the 23.42% drop in the Loan to Deposits ratio from the 51.22% in 2017 to 39.22% now

Investment Ratios
• The amount earned per unit of Stanbic IBTC is currently estimated at N2.30 based on the current 10.049 billion units of shares. The said earning is 42.80% improvement over the N1.61 earned in the previous first quarter when the share outstanding was 10 billion units
• Similarly, Total Comprehensive Income for the period stood tall above 2017 statement by 22.68%
• Despite the great 128% increase in the market price of Stanbic IBTC within the two periods (from N21.49 to N49.00), the amount earned only stood below last year’s by 37.37%. In other words, a yield of 4.68% was achieved in the three financial months against the 7.48% last year.
• Reasonable investor confidence was achieved within the period, based on the slight improvement in the PE/Ratio from 3.34x to 5.34x
• Should investors’ preference and sentiments be removed, one could rate Stanbic IBTC shares over priced. This is especially going by the 2.51x Price to Book Value. Also, see the Book Value estimate at N19.50 downward value of up to 60.20% from the current market price.

Findings
• We have confirmed an appreciable growth in the key financial indices of Stanbic IBTC. We also foresee this growth being maintained at reasonable rate through the year
• The calculated attempt of management to avoid risky assets is also commendable and have increased the financial institution’s management rating
• The low Debt to Equity Ratio is equally a ratio that should be strictly maintained as this will improved investors’ confidence in the shares of Stanbic IBTC.
Valuation
In valuing each unit of Stanbic IBTC shares we considered both the 60k interim dividend paid in the H1 of 2017 and the 50k final dividend, resulting in a total of N1.10 cash dividend enjoyed by investors through the 2017 financial year.
Considering the sharp improvement in the company’s figures, we explored the 2-stage H-Model valuation method with the following parameters gl= 20%, gs= 6%, H=5, Required Return = 10%.
Of course, current dividend was set at N1.10 while the current market price used was N49.00.
We therefore arrived at an intrinsic value of N48.40 for each unit of Stanbic IBTC shares. This is only implying that the market has rightly priced the shares of the financial institution.


