Company: CAP Plc
Rating: Buy
Current Market Price: N24.75
Current Dividend: N2.90
Year High: N37.40
Year Low: N24.75
Fair Value: N33.00
Equity Analyst: Tunde Segun Jeariogbe
Key Investment Ratios
• This report observed the half-year financial statistics of Chemical & Allied Plc (CAP), compared the same with figures released in the comparative period of 2018 and established a growth status while projecting accordingly.
• In the review period, the company further cleaned up her debt profile from what was reported in its first-quarter financials, just as the amount reported as Interest Expense represents only the Lease Interest Expense.
• However, operating with no interest yielding liability has both positive and negative sides. We shall explain these below.
• It may imply that the management is not effectively utilizing the capital available in the business. It is an established fact that any growing business with lots of innovations will consistently require more capital.
• Nevertheless, not utilizing interest yielding liabilities will also save the company from various economic challenges associated with debt financing.
• The above confirm reasons for the mild growth in the income elements during the period as against the corresponding half-year of 2018.
Company figures
• The turnover figure reported for the period inched above the corresponding quarter by 2.99% to stand at N3.90 billion as against N3.79 billion in 2018.
• Cost of Sales also stood above the corresponding quarter by marginal 3.76%. A total of N2.04 billion is currently stated as Cost of Sales as against N1.97 in 2018 half year.
• Operating Profit is currently estimated at N1.03 billion, this is 12.01% below the N1.18 billion achieved in 2018 half-year business cycle.
• Operating Expenses, on the other hand, is estimated at N852.62 million, up from the N669.75 million reported at the end of 2018 half-year.
• As noted above, Finance Cost dropped to N434,000 compared to N2.39 million in 2018 half year. Please note that the difference between both figures is the same as 81.89%.
• Due to the substantial income made from short term bank deposit over the two comparable periods in this report, Net Finance Income stood at N236.95 million against N167.23 million.
• Profit before Tax is currently estimated at N1.27 billion, same as 5.35% below the N1.34 billion reported in 2018 half-year financial.
• Profit after Tax improved at a similar rate, at the current estimate of N868.04 million, as against N917.09 million.
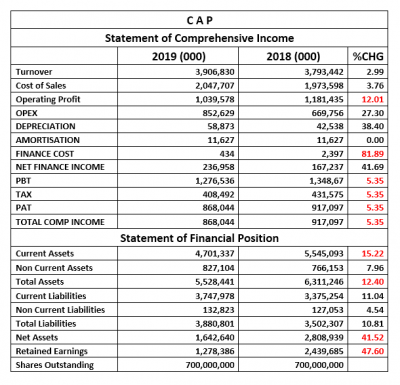
• At the end of the first six months of 2019, the Current Assets of CAP Plc is valued at N4.70 billion, which is 15.22% below the N5.54 billion valued in 2018 half year.
• Nevertheless, Non-Current Assets is valued at N827.10 million, 7.96% above N766.15 million at the end of 2018 half-year activities.
• Current Liabilities was dominated by three items, namely Trade & Other Payables, Current Income Tax Liabilities and Dividend Payable, was above the comparable period value by 11.04% at the current estimate of N3.74 billion.
• Non-Current Liabilities, on the other hand, consist of Lease Liabilities and Deferred Taxation Liabilities. It is currently worth N132.82 million as against N127.05 million.
• Due to the difference between Total Assets and Total Liabilities in the two-period compared, Net Assets stemmed below comparable period by 41.52% at the current value of N1.64 billion against N2.80 billion.
• Retained Earnings equally dipped by 47.60% to stand at N1.27 billion, compared to the N2.43 billion stated in its 2018 half-year result.
Financial Strength/Solvency Ratios
• Debt Ratio is currently estimated at 0.70x, as against 0.55x in 2018 half-year, which implies that Total Liabilities is the same as 70% of Total Assets. Please understand that the company’s liability is dominated by non-interest yielding elements.
• Total Debt to Equity was equally estimated at 2.36x, as against 1.25x estimated in the comparable quarter.
• It was also estimated that Total Equity is the same as 30% of the Total Assets of the company, as against the estimated 45% at the end of 2018.

Profitability Ratios
• Pre-Tax Margin dropped by marginal 8.10% to 32.67%, as against the 35.55% estimated at the end of 2018 half-year.
• Effective Tax Rate was perfectly stable within both periods compared in this report.
• Cost of Sales to Turnover was equally stable within the periods under consideration. We have estimated that CoS is currently 52.41% of Turnover as against the previous estimate of 52.03%.
• Return on Equity stood at 52.84% against 32.65% estimated in 2018.

Efficiency Ratios
• Operating Expenses to Turnover value is same as 21.82%, this is 23.61% improvement over the 17.66% estimated from 2018 half-year financials.
• Turnover to Total Assets Ratios stood at 70.67%, as against 60.11%, which is 17.57% improvement in efficiency over the comparable period of 2018.
• Working Capital Ratio (which indicates a company’s effectiveness in utilising its working capital) was estimated at 4.10x against the 1.75x estimated in the similar period of 2018.
• It stood above unity within the two periods, although we established a drop of 23.65%.

Investment/Valuation Ratios
• Between the 2018 half-year earnings release and 2019, investors had priced down each unit of CAP Plc by 29.29%, from N35.00 to N24.75%.
• Thus, the portion of CAP Plc’s earnings ascribed to each unit of its listed shares (earnings per share) is estimated at N1.24 through the first 6 months of 2019, which is 5.35% below the N1.31 earned in the similar period of 2018.
• P/E-Ratio for the period stood at 19.96x, as against 26.71x in a similar period of 2018.
• The said earnings per share is a yield of 5.01% of the total market price of each unit of CAP Plc shares on the floor of the exchange as at the time this result was made available to the investing public.
• Meanwhile the value ascribed to each unit of CAP Plc shares in its book (Book Value) is N2.35, down from the previous estimate of N4.01, ordinarily, this is an overvalued position.
• Further confirming this stand is the 10.55x Price to Book Value estimated from its book. However, negating the overvalued state of the company’s shares is the high Return on Equity (ROE) estimated above.

Valuation
Our blend of valuation models considered the consistent dividend payment of CAP Plc and the stability in its valuation ratios. We also put into consideration the seeming stability in the performance indices over the period and the low equity holders’ risk. Thus we have valued each unit of CAP Plc at N33.00, which is 33.33% below its current market worth as at the time the latest financials were made available to the investing public. We have therefore rated it a Buy.


