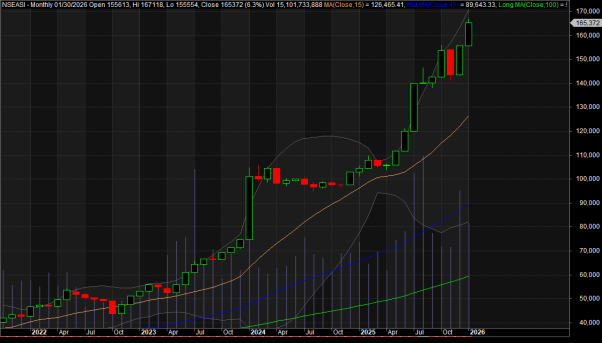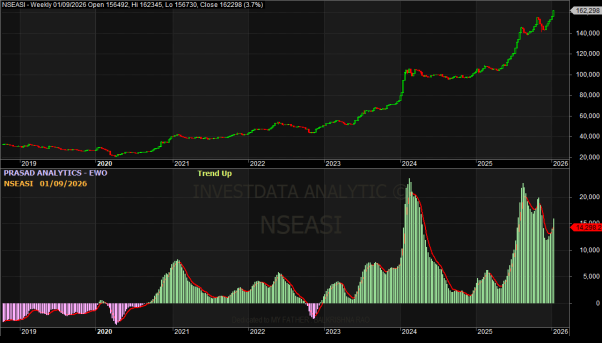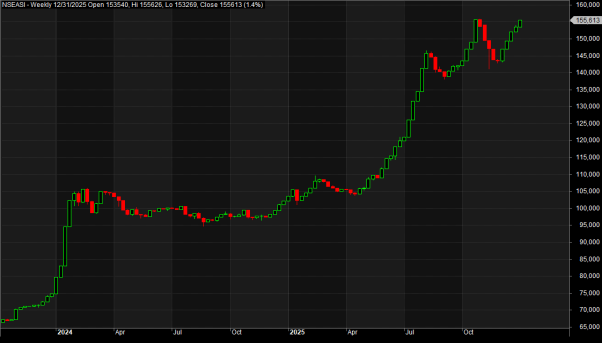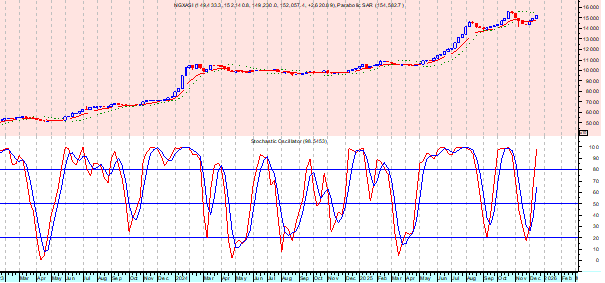
Trend and volume are your friend technically in the the world of trading and investing. As such, following these trends and transaction volumes in the general market and individual stock helps market players profit from participating in the market, because price is all we trade and the movement of this price is what creates wealth for discerning investors and smart traders in any market cycle or phase. Understanding change in trend or price which is a function of change in sentiments, pattern and momentum at any given time.
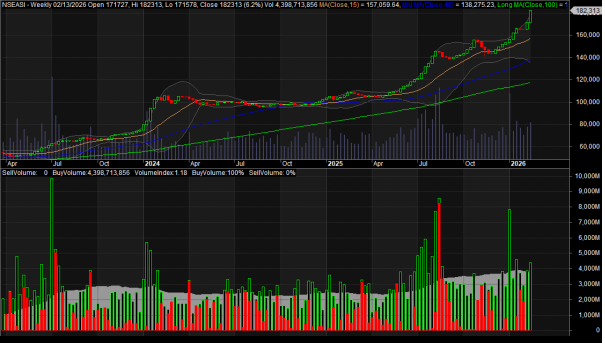
Market breadth and volume pattern have been oscillating in recent sessions while money flow index has been declining since January 30, on the daily time frame and February 2 on the weekly chart, signaling a change in the weakness of trend, as the market runs out of gas. This can be called the supply zone, resistance, distribution phase, and consolidation etc, as it indicates correction or pullbacks that is a transitional move to the decline phase. This eventually leads to accumulation phase and expansion that ushers in the markup phase or bull market.
So, to avoid losing money or the market taking back your profit, you must understand market structure and timing for profitable investing in any market situation. The factors that drive these changes in the market includes fundamentals such as liquidity level, corporate earnings, and macroeconomic data. There also government policies- whether fiscal or monetary, seasonality, information about alternative investment windows, psychology of market players and others. As the NGX index action remain in the consolidation stage and distribution phase arising from profit taking and panic selling, with investors in flight for safety in the fixed income market. This is happening amid the earnings season and dividend expectations ahead of the January Consumer Price Index and upcoming policy meeting of the Central Bank of Nigeria (CBN).
Meanwhile, as we look forward to future trading, let the index and price actions, charts and patterns below guide your trading decision:
NGXASI Weekly Chart (Opening)
NGX Banking Index Weekly Chart

NGX Insurance Index Weekly Chart
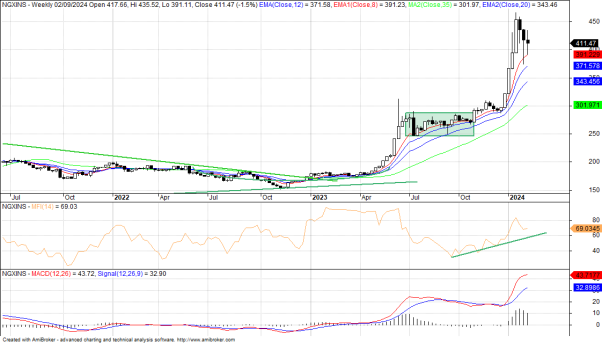
NGX Industrial Goods Index Weekly Chart

NGX Consumer Goods Index Weekly Chart

NGX Oil/Gas Index Weekly Chart

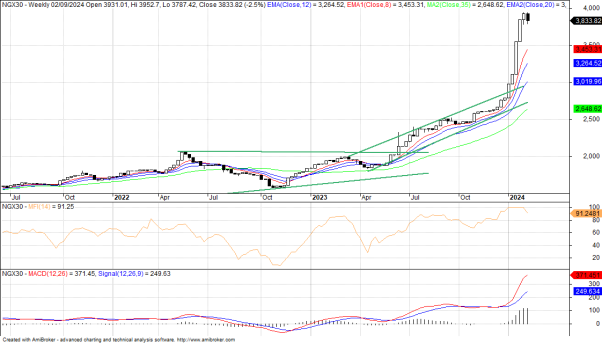
NGX 30 Index Weekly Chart
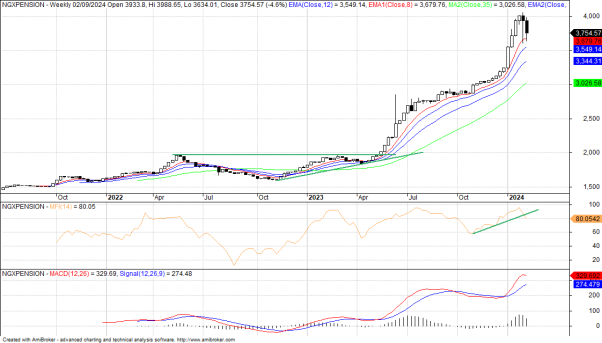
NGX Pension Index Weekly Chart
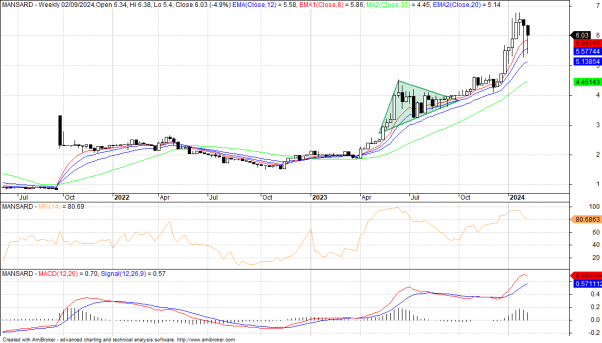
AXA Mansard Insurance Weekly Chart
Consolidated Hallmark Insurance Plc Weekly Chart

United Capital Weekly Chart

Dangote Sugar Weekly Chart
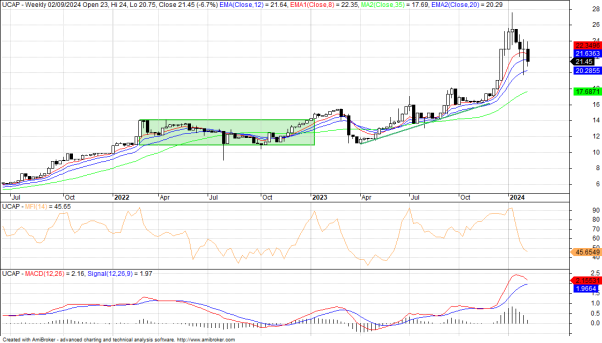
Transcorp Weekly Chart
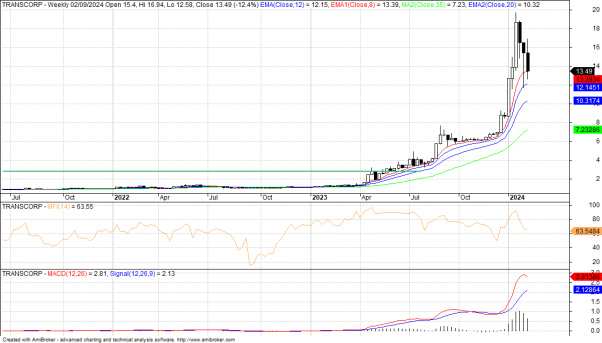
Dangote Cement Weekly Chart

BUA Cement Weekly Chart

NASCON Weekly Chart

Nahco Weekly Chart
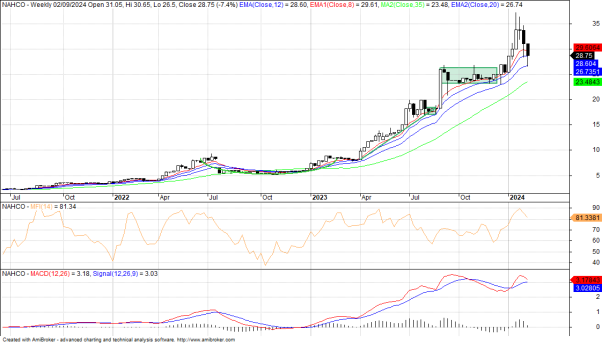
Geregu Power Weekly Chart

Zenith Bank Weekly Chart


