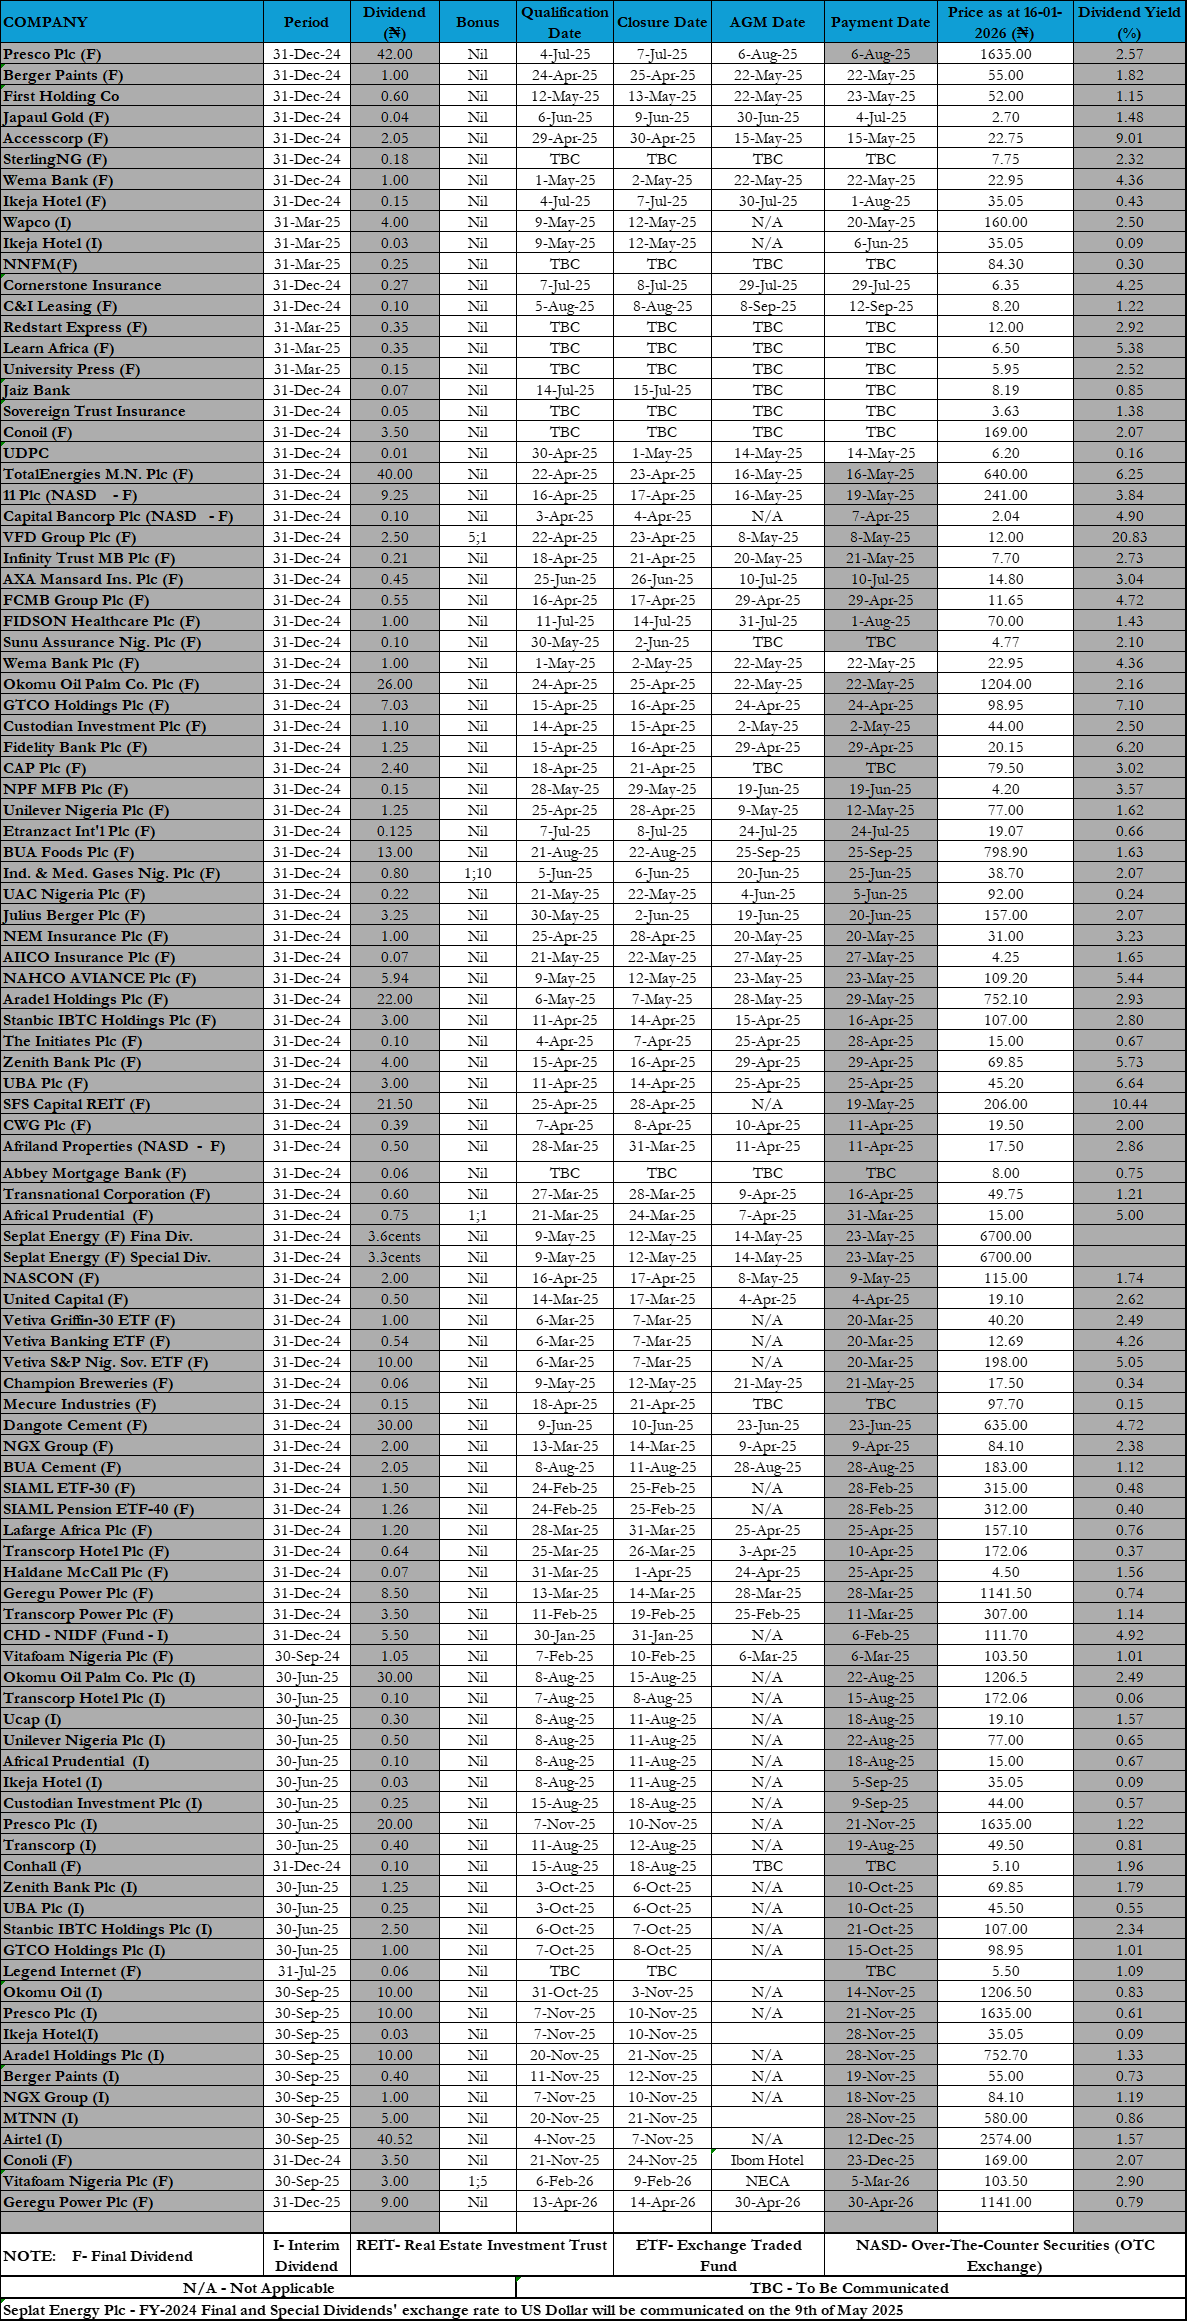
Chart patterns and trends are a function of price movement, and prices do not change based on fundamentals alone! Prices move up or down based on the perception of fundamentals. When an investors understands this basic concept, they have a stronger perspective on when prices are reversing, and when trends will continue.
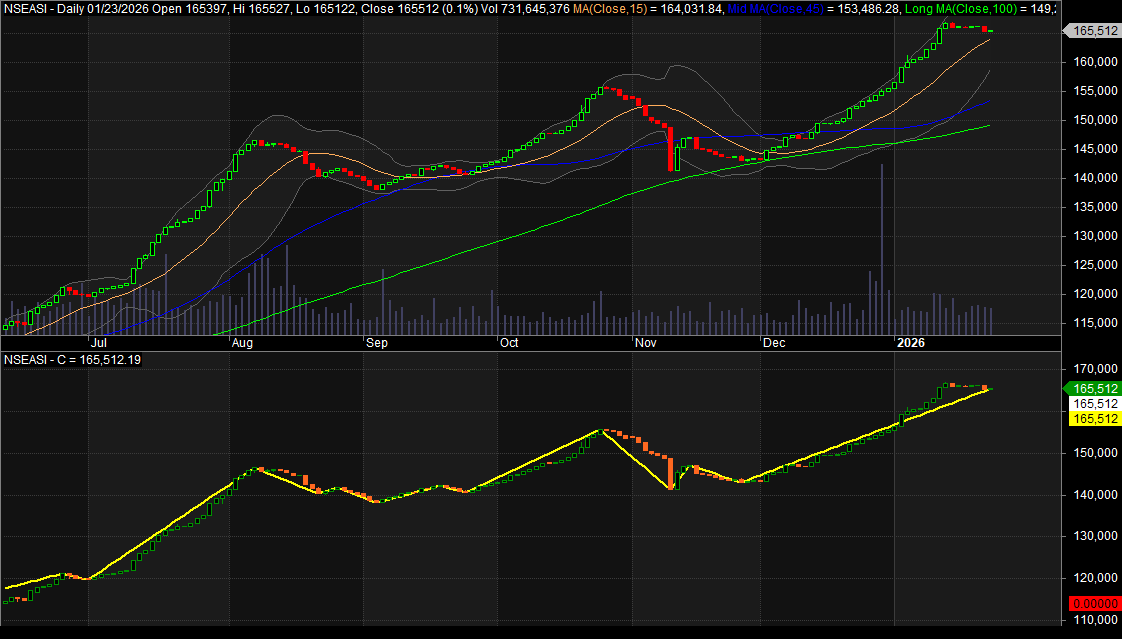
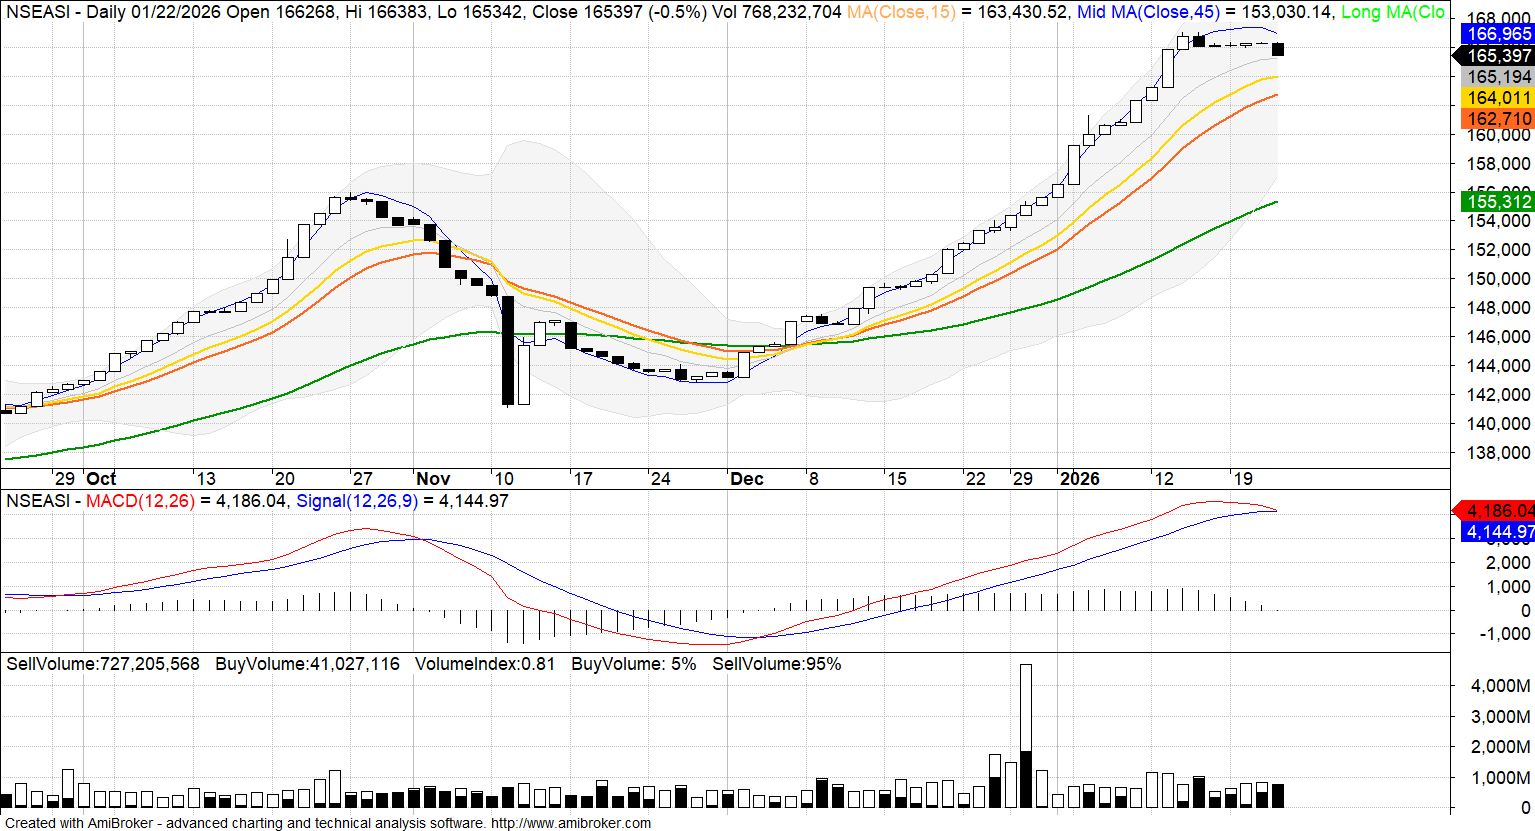
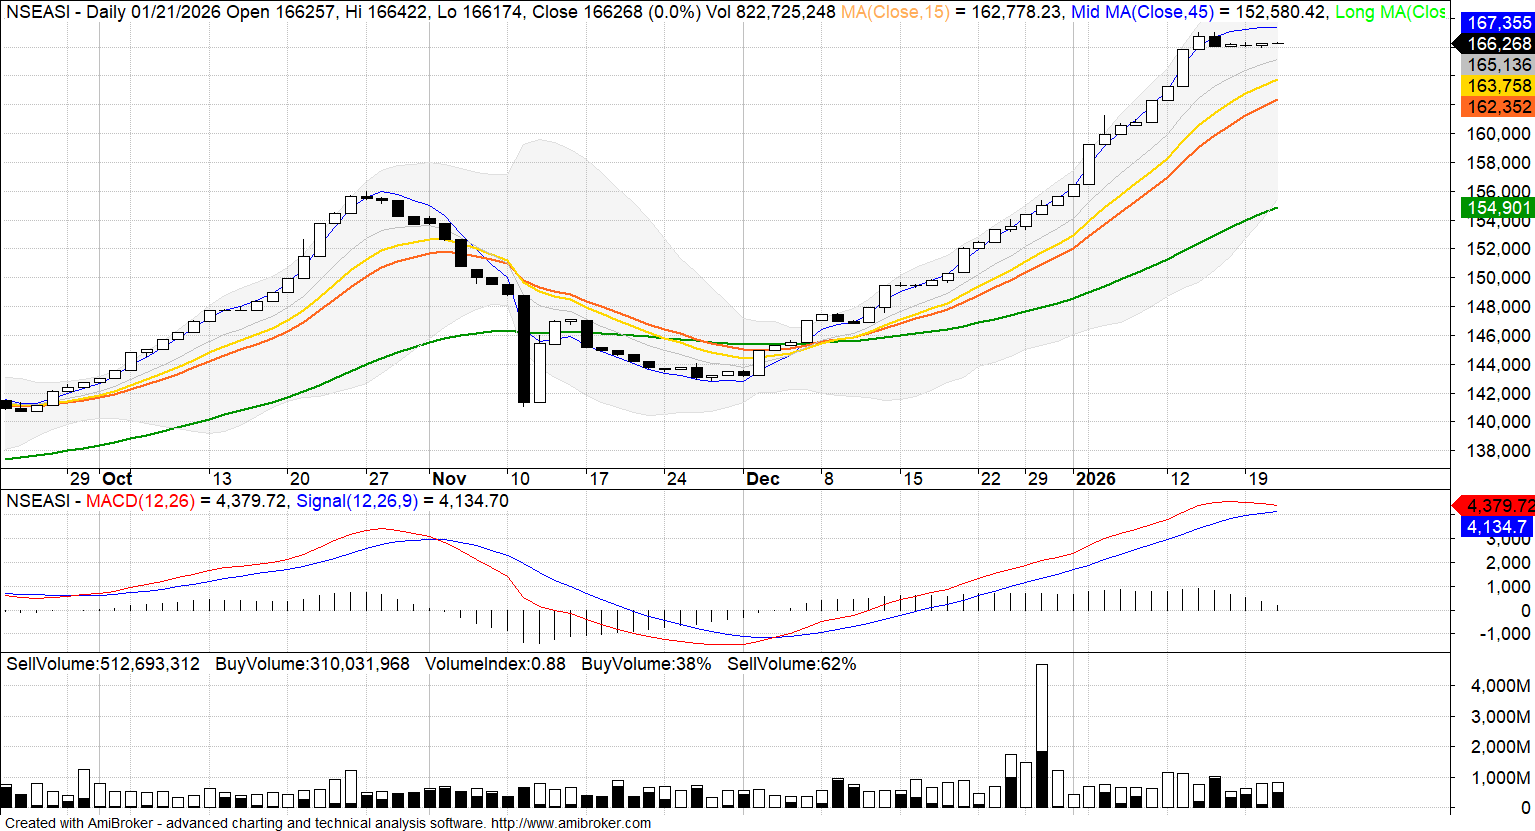
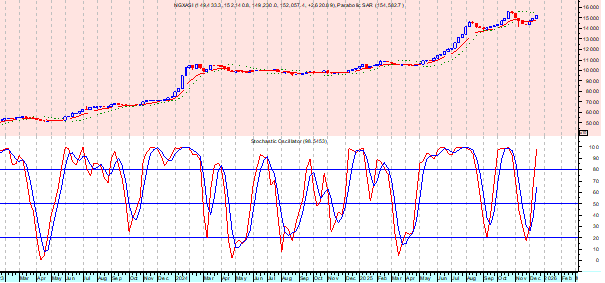
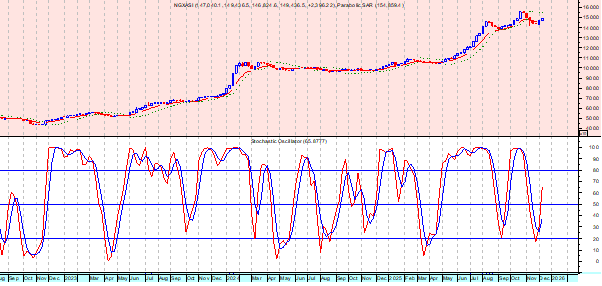
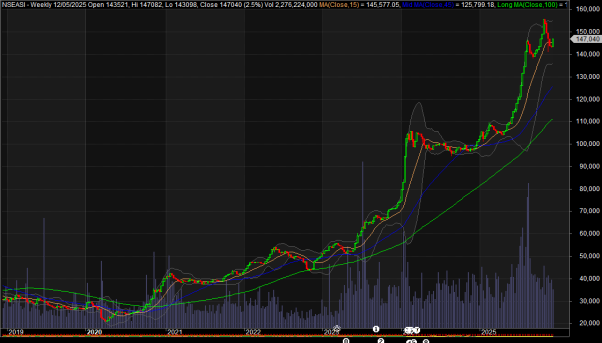
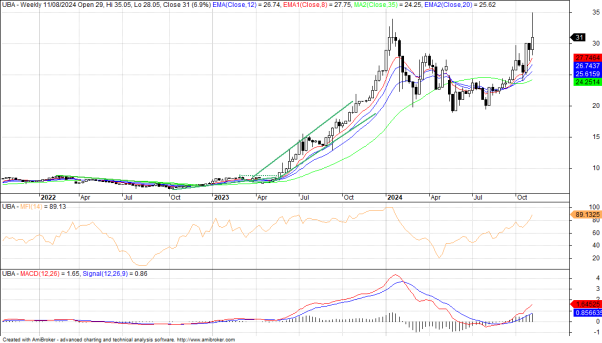
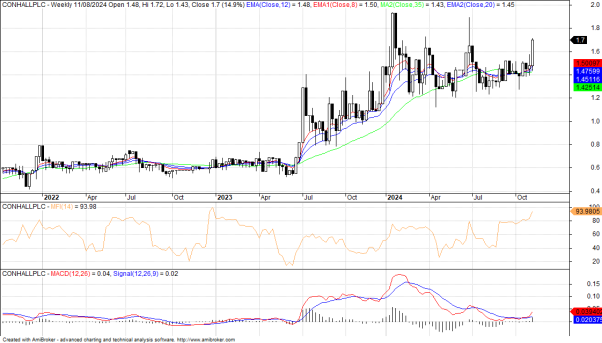
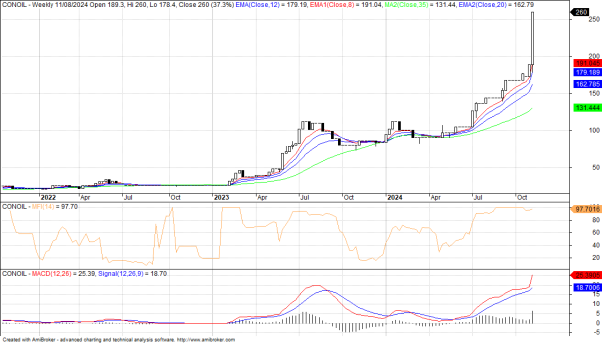
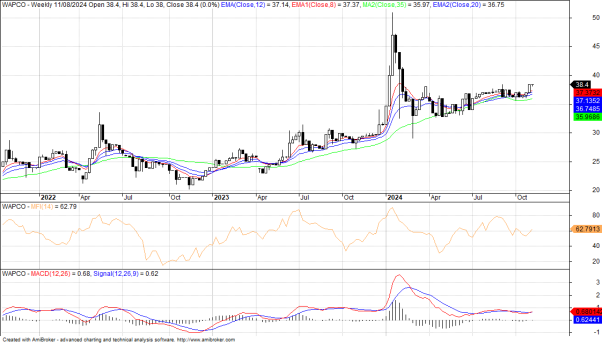
Simply put, if you see a candlestick bullish reversal signal in the oversold condition, the probability dictates that an uptrend is about to occur. The same analysis can be applied to a sell signal. If you witness a candlestick sell signal in the overbought condition, the probabilities indicate a downtrend is about to start. See the charts below.
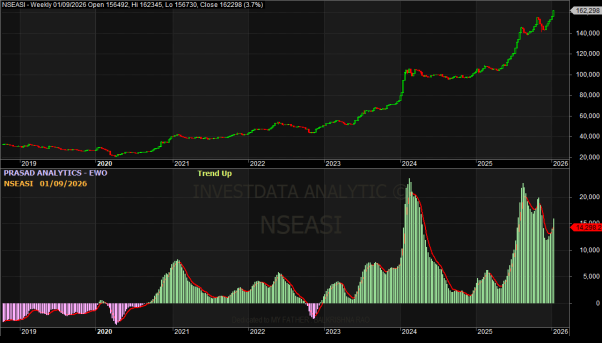
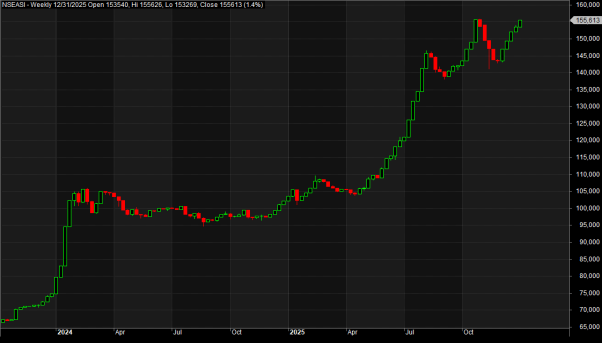
NGXASI Weekly Chart (Opening)
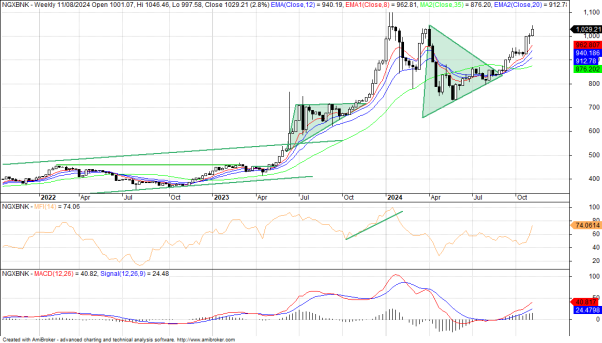
NGX Banking Index Weekly Chart
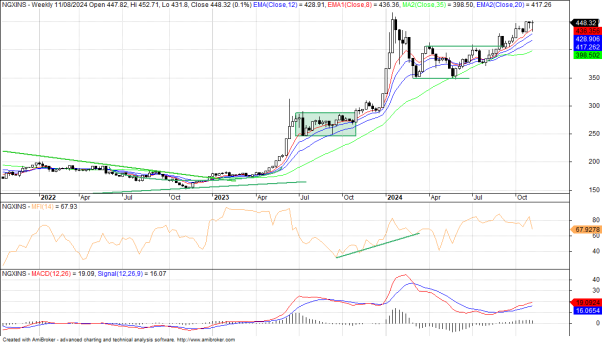
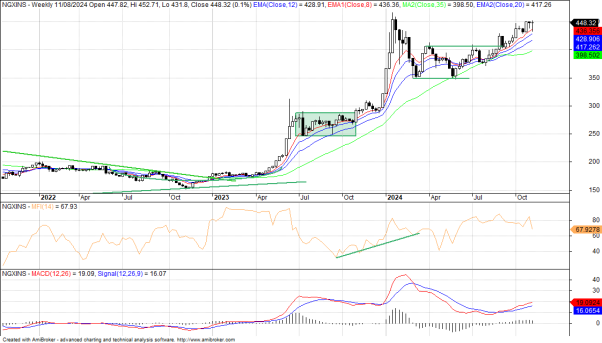
NGX Insurance Index Weekly Chart
NGX Consumer Goods Weekly Chart
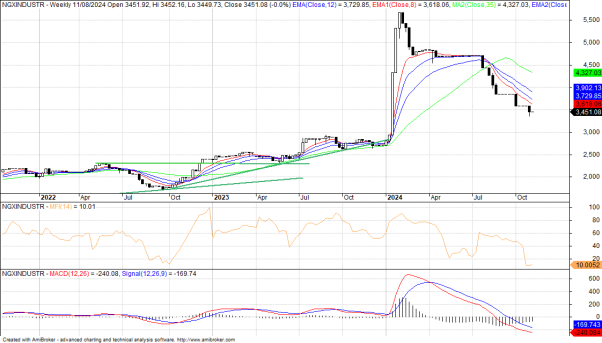
NGX Industrial Goods Weekly Chart
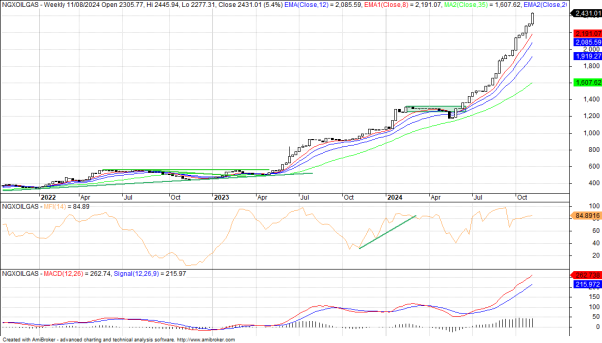
NGX Oil& Gas Index Weekly Chart
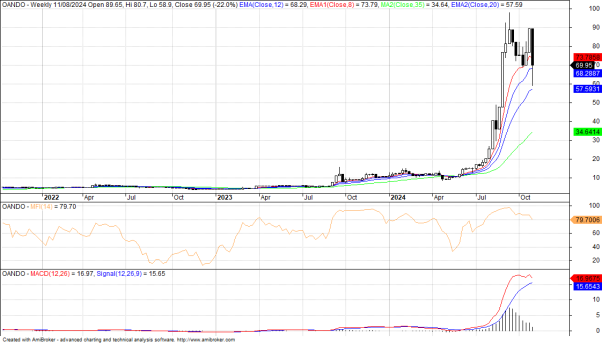
Oando Weekly Chart
UBA Weekly Chart
Conhall Plc Weekly Chart
Prestige Assurance Weekly Chart
Zenith Bank Weekly Chart

Conoil Weekly
Wapco Weekly Chart
Nahco Weekly Chart

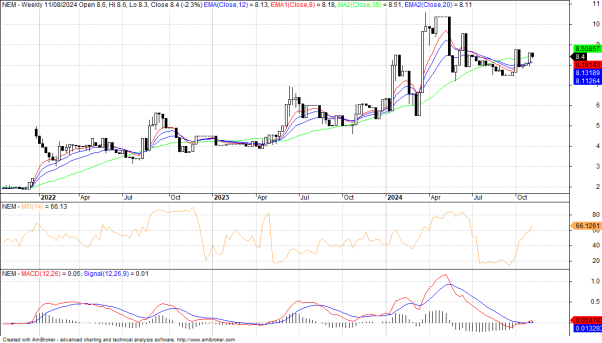
NEM Weekly Chart
CWG Weekly Chart

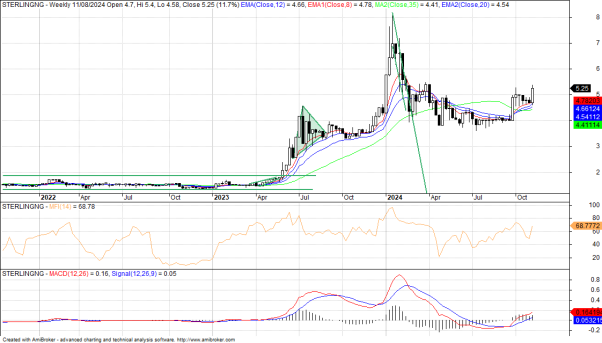
SterlingNG Weekly Chart
