It was a bullish week on the Nigerian Exchange (NGX), with the market recording four trading sessions of up market and a day of marginal loss with the composite All-Share Index closing higher amid bargain hunting, and ahead of macroeconomic data and corporate numbers which are expected to reveal the state of the economy and give market direction. Market players took advantage of the pullbacks to buy into value and defensive stocks with higher upside potentials.
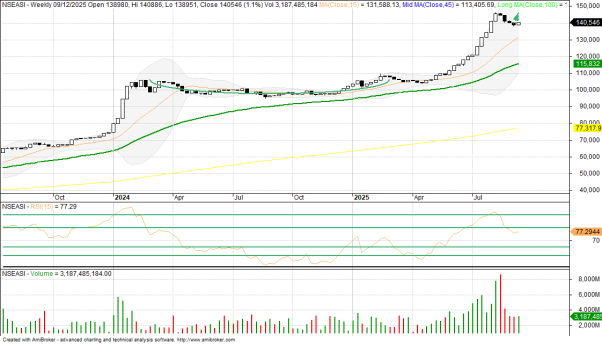
Overall, the NGX All-Share Index and market capitalization gained 1.12% week-on-week, closing at 140,545.69 points and ₦88.92 trillion respectively.
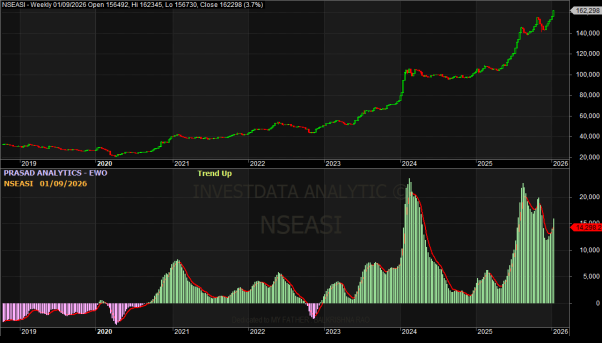
The daily chart below reveals recovery in the midst of profit booking as recorded on Friday, when buying sentiment stood at 44%.
NGXASI Daily Chart
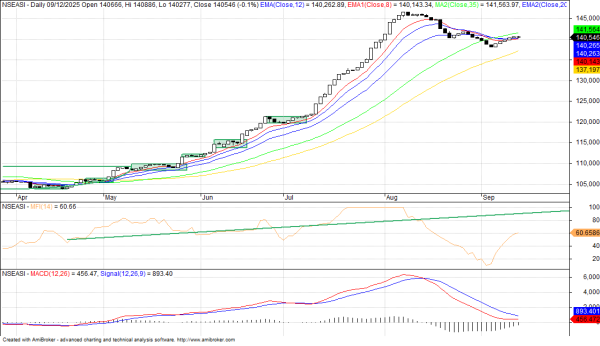
The first trading season of the week opened on a positive note, extending the previous gain, as the benchmark NGX All-Share index rising by 0.30% to settle at 139,394.75 points. Market capitalization grew by ₦262.42 billion to ₦88.20 trillion. PZ, TRANSPOWER, and DANGSUGAR topped the list of 38 gainers, while 12 stocks closed in the red. Trading volume dropped 47.89% to 947.87 million units valued at ₦17.97 billion, with FCMB emerging as the most traded stock.
The NGX’s positive momentum extended on Tuesday, when the index inched 0.29% higher to 139,796.11 points, adding ₦253.95 billion in value to close at ₦88.45 trillion. Gains were driven by MECURE (+9.92%) and WAPCO (+6.15%) as 35 stocks advanced against 18 decliners. Activity slowed, with volume dipping 30.46% to 659.17 million units worth ₦12.51 billion, though FCMB maintained its lead in turnover.
By the midweek, the composite NGX index added 0.41%, closing at 140,365.36 points with a ₦360.18 billion which boosted the market capitalization to ₦88.81 trillion. BERGER (+9.86%), WAPCO (+6.71%), and UNILEVER (+6.33%) led 37 gainers against 22 losers, with BERGER touching a fresh 52-week high. Market activity improved as volume rose 16.47% to 767.73 million units worth ₦40.64 billion, driven largely by FCMB and ARADEL.
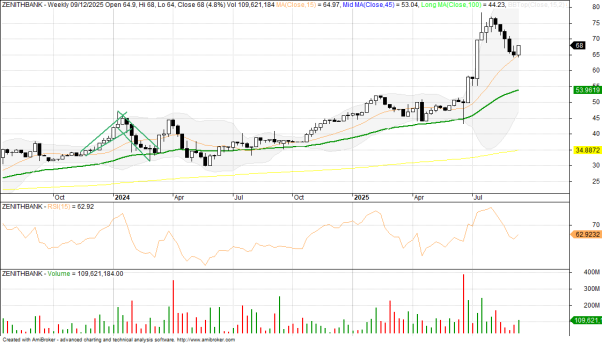
The bullish trend was sustained on Thursday with a 0.21% gain, pushing the index to cross 140,000 psychological line to 140,665.84 points and market value to ₦89 trillion after a ₦190.13 billion increase. GUINNESS (+10.00%) and CAP (+9.23%) topped the 41 gainers, while only 12 stocks declined. ETRANZACT and NCR also achieved new 52-week highs. Turnover, however, fell sharply by 50.74% to 378.18 million units worth ₦12.41 billion, with JAPAULGOLD and ZENITHBANK leading trades.
The market, however, closed the week slightly lower on Friday, slipping 0.09% to 140,545.69 points, erasing ₦81.44 billion from market capitalization to settle at ₦88.92 trillion. Losses in PZ, NGXGROUP, and DANGCEM dragged the index, although gainers (30) outnumbered losers (20). Trading volume picked up by 14.95% to 434.73 million units worth ₦16.17 billion, with NSLTECH and ARADEL driving activity.
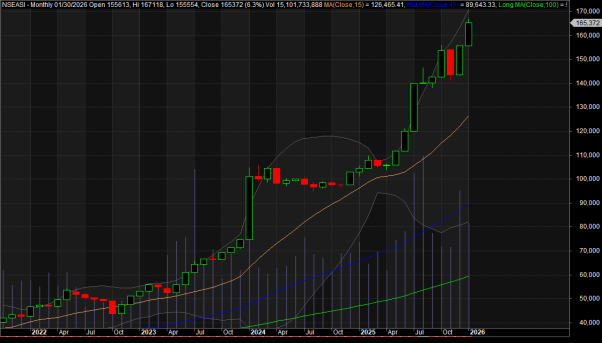
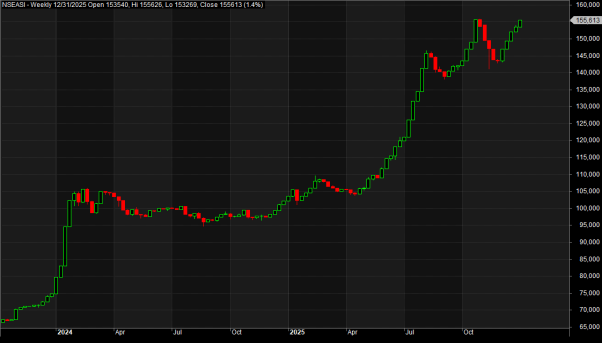
NGXASI Weekly Chart
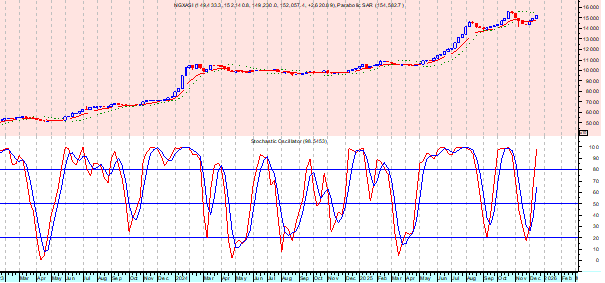
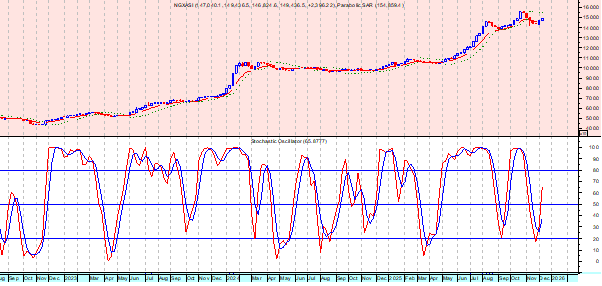
Technically, the index trades comfortably above its 20- and 50-day moving averages so far, reinforcing the current bullish trend. Momentum indicators remain strong, with the RSI nearing overbought territory but not yet signalling a reversal. The 140,000 level now serves as a key support zone, while a breakout above 141,000–141,500 points could open the way for further upside. In the near term, we expect cautious buying to persist, driven by portfolio rebalancing and positioning ahead of corporate releases, though intermittent profit-taking may create brief pullbacks.
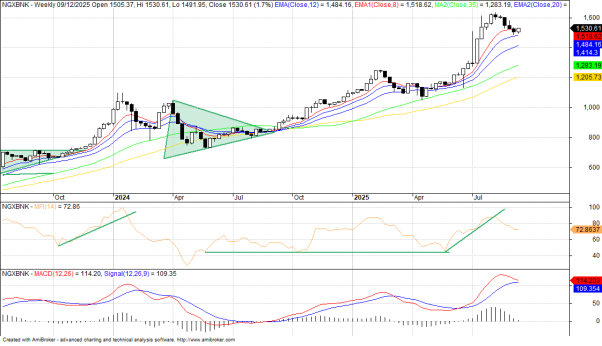
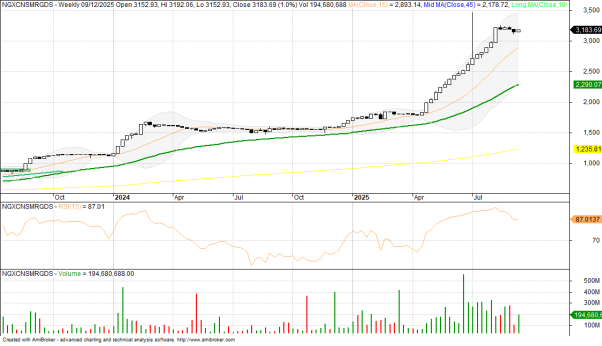
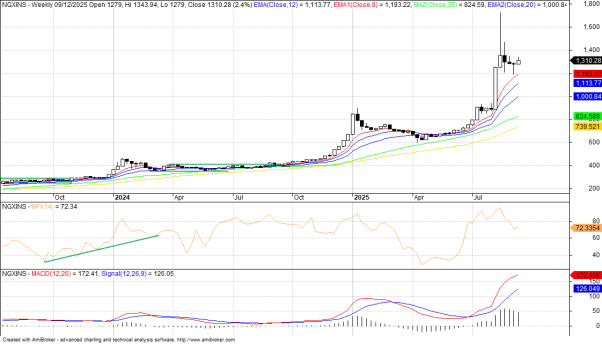
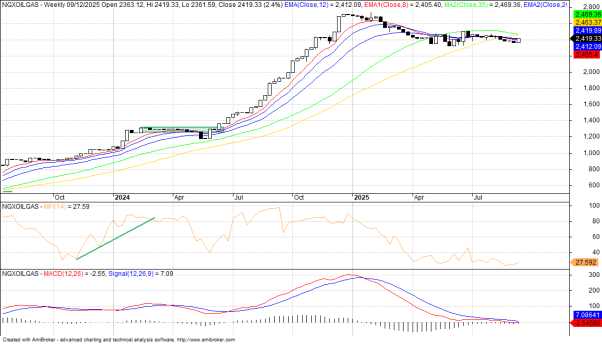
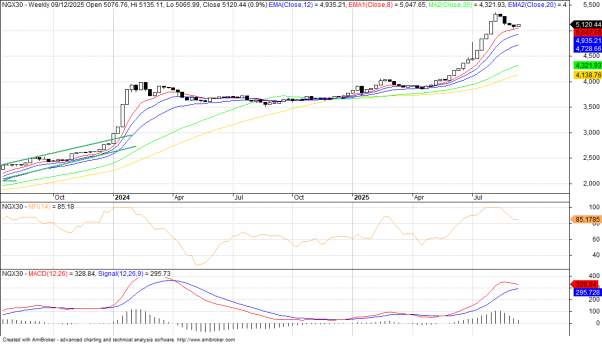
Week-to-date, the All-Share Index has increased by 1.12%, with the NGX 30 rising by 0.86%. The Banking Index posted a gain of 1.68%, the Pension Index increased by 1.48%, the Insurance Index increased by 2.45%, and the Consumer Goods Index increased by 0.98%. Oil and Gas Index increased by 2.38%. On a year-to-date basis, the All-Share Index is up 36.55%, while the NGX 30 has gained 34.33%, The Banking Index surged 41.13%, the Pension Index jumped 48.12%, the Insurance Index rose 82.49%, and the Consumer Goods Index posted a robust 83.85% increase. However, the Oil and Gas Index declined by 10.79%. Market breadth was positive, with 70 stocks advanced and 22 declined.
ETranzact Weekly Chart
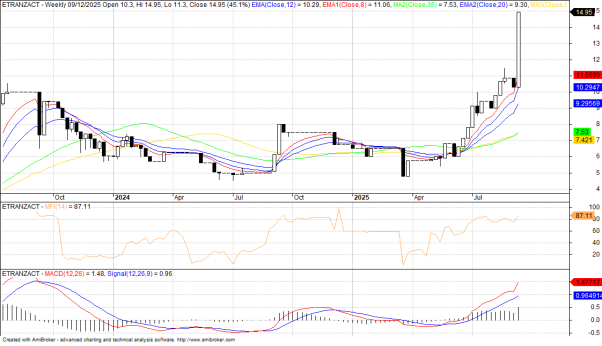
On the gainers’ chart, E-Tranzact International,a Nigerian-based fintech and payment solutions provider,led with a rally from ₦10.30 to ₦14.95, posting a 45.15% weekly gain. Regency Assurance followed, climbing 27.69% to close at ₦1.66 from ₦1.30. Chellarams rose from ₦10.50 to ₦13.30 (+26.67%), Daar Communications advanced 23.26% to end at ₦1.06, while Royal Exchange gained 22.34% to settle at ₦2.30.
Union Dicon Salt Weekly Chart
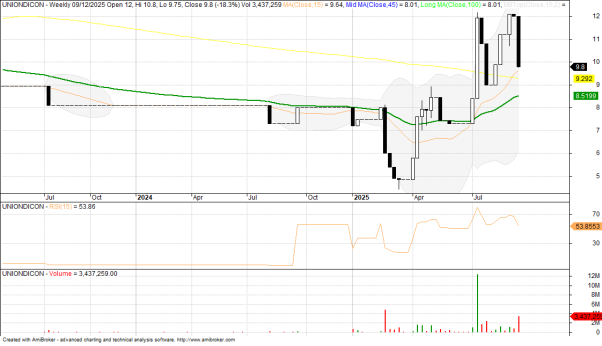
On the flip side, Union Dicon Salt,a Nigerian company engaged in the processing, refining, packaging, and marketing of edible salt, topped the losers’ table, sliding 18.33% to close at ₦9.80 from ₦12.00. Thomas Wyatt shed 16.33% to finish at ₦2.51, Secure Electronic Technology dropped 10.42% to ₦0.86, Nigerian Enamelware lost 10.00% to close at ₦35.10, while May & Baker declined 9.97% to settle at ₦16.25.
Trending in the Economy: The Central Bank of Nigeria (CBN) has set up a Compliance Department to tighten oversight on financial crimes, market conduct, cybersecurity, and corporate governance. This comes after a 45% spike in fraud cases in 2024, largely driven by digital transactions. Central Bank of Nigeria has instructed banks and other financial institutions to send all compliance-related reports to the new department and reminded them to finalize ISO 20022 migration and geo-tag all payment terminals before the October 31, 2025 deadline.
Meanwhile, Nigeria experienced another nationwide blackout on Wednesday as a generator fault caused the national grid to collapse at 10:20 GMT, according to the Independent System Operator (NISO). Power supply is gradually being restored, starting with Abuja through the Shiroro plant. Frequent grid collapses continue to cripple daily activities, leaving businesses and households reliant on expensive fuel generators. Experts insist that major investments are needed to achieve a reliable power supply to drive the envisaged $1 trillion economy of the government.
Global Market and Oil: Global stocks ticked higher on Friday, building on Thursday’s record-setting close, while U.S. Treasury yields reversed their prior day’s drop as investors adjusted for likely interest rate cuts. Fresh data from the University of Michigan showed consumer sentiment slipping for the second month in a row to its weakest level since May. Respondents cited concerns about business conditions, job prospects, and rising prices. Inflation expectations held steady at 4.8% for the next year but rose to 3.9% over a five-year horizon, stoking fears that higher prices may persist. This shift helped push Treasury yields higher as markets braced for prolonged inflation risks.
On Wall Street, trading was mixed following Thursday’s surge on hopes that the Fed will begin a rate-cut cycle at its September 17 meeting. The Dow shed 273.78 points, or 0.59%, to close at 45,834.22, while the S&P 500 eased 0.05% to 6,584.29. The Nasdaq advanced 0.45% to 22,141.10, setting another record close. For the week, the S&P gained 1.59%, the Nasdaq 2.03%, and the Dow 0.95%.
MSCI’s global equities index edged up 0.07% to 972.15, while Europe’s STOXX 600 slipped 0.09%, giving back earlier gains.
The dollar regained strength, with the dollar index inching up to 97.60. The greenback climbed 0.26% against the yen to 147.58 as U.S. and Japanese officials reaffirmed that neither country would actively target currency levels. The euro was nearly flat at $1.1735, and the pound weakened 0.09% to $1.356 after UK GDP data showed no growth in July.
U.S. Treasury yields rose, with the 10-year at 4.062% and the 2-year at 3.558%, as traders positioned for next week’s Fed decision. Crude oil prices advanced as supply concerns resurfaced after a Ukrainian drone strike disrupted shipments from a major Russian port. WTI settled 0.51% higher at $62.69 per barrel, while Brent climbed 0.93% to $66.99.
Sectoral Indexes Weekly Chart Position
NGX Banking Index Chart
NGX Consumer Goods Index Chart
NGX Insurance Index Chart
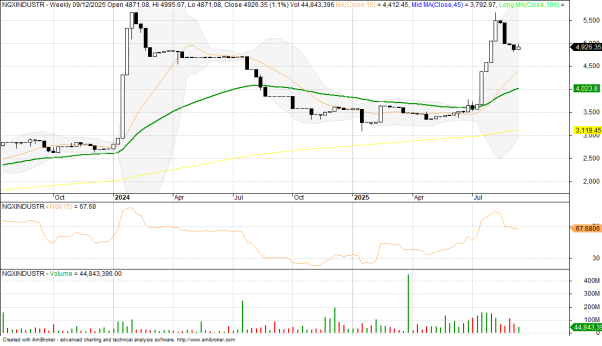
NGX Industrial Goods Index Chart
NGX Oil & Gas Index Chart
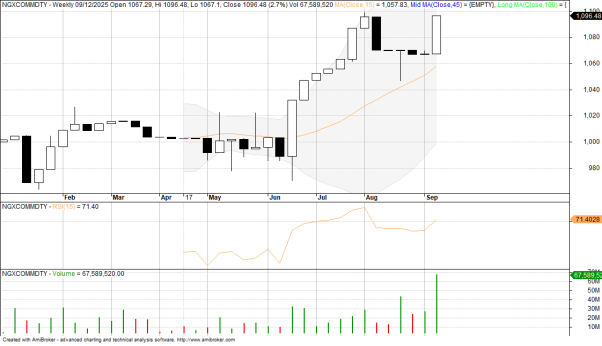
NGX Commodity Index Chart
NGX 30 Index Chart
Zenith Bank
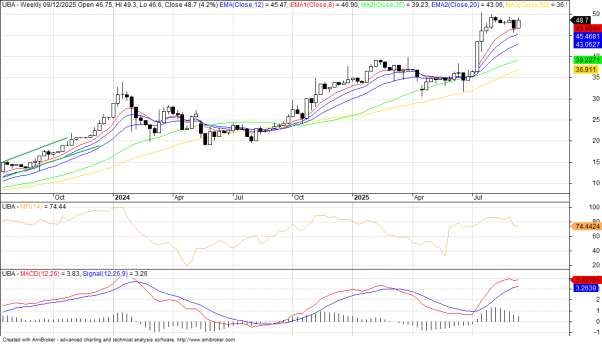
UBA
