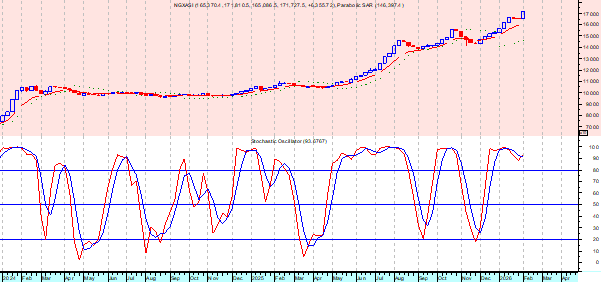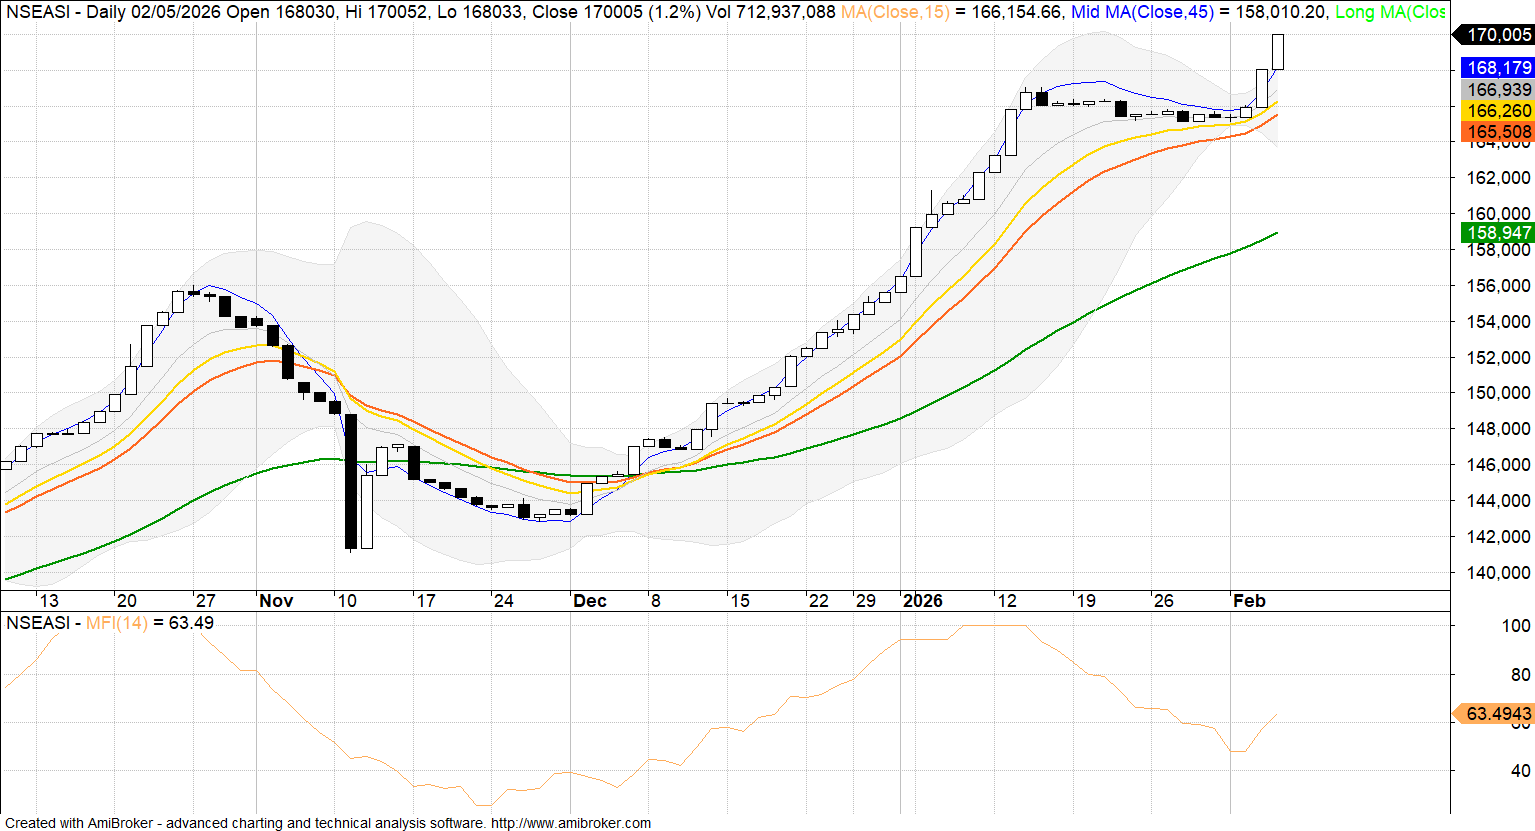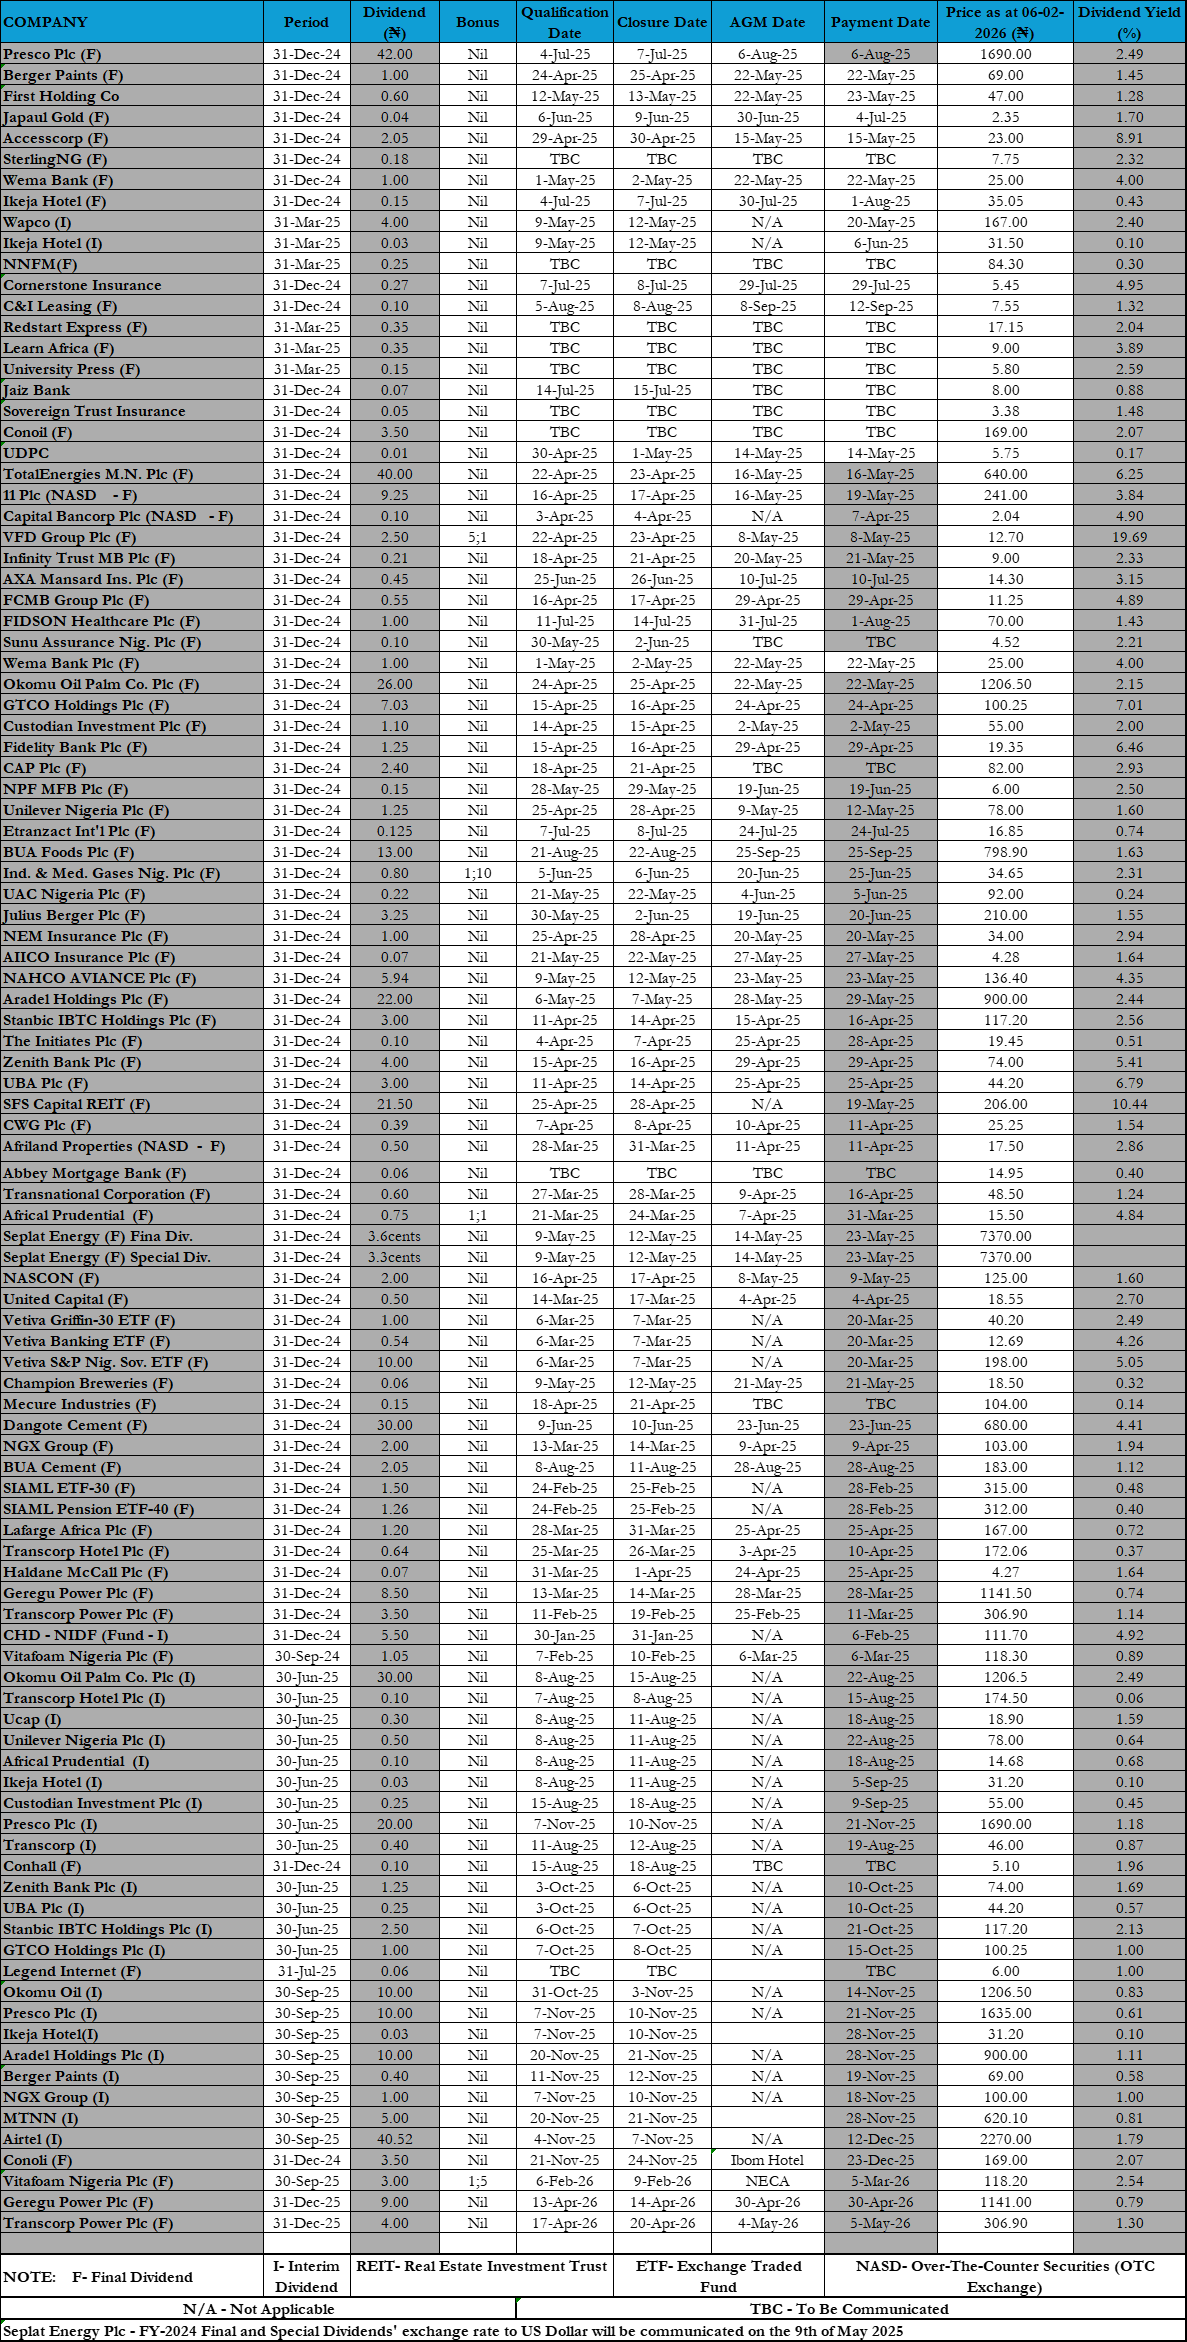
Quarter Under Preview: 9-Months
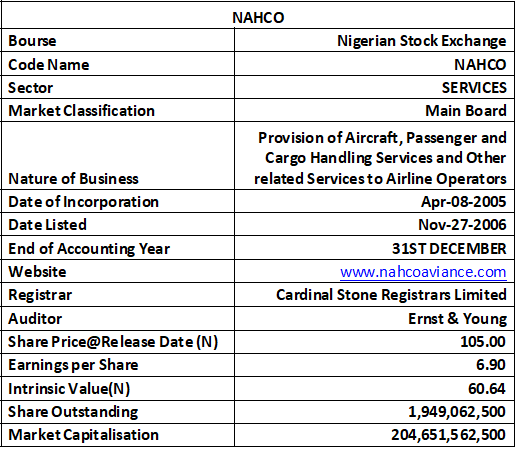
Current Share Price: N105
Latest Final Dividend: N5.95
Latest Interim Dividend: N
Estimated Beta Value: 0.52x
Estimated Intrinsic Value: N60.64
Analyst: Jeariogbe Tunde Segun
The Company
The Nigerian Aviation Handling Company PLC (NAHCO) is a Nigeria-based ground handling company engaged in the provision of services such as aircraft, cargo and passenger handling, as well as passenger profiling, crew transportation, energy and power distribution and leasing of ground handling equipment.
The Company has three reporting segments namely: Ground Handling, Cargo Handling and Others. The Ground Handling segment is engaged in ramp services, passenger profiling, baggage handling and crew transportation. The Cargo Handling segment is involved in cargo documentation services for airlines, besides import and export facilitation through customs bonded warehouses across its network. The Other segment is engaged in equipment rentals and lease rentals.
The subsidiaries of the company are NAHCO Free Trade Zone Limited (NFZ) and Mainland Cargo Options Limited (MCO). NFZ is an airport free zone created to provide storage, logistics and operational services.
Released Financials
At the end of its operations for the first nine months of 2025, NAHCO reported N47.759 billion as Turnover, which is 40.69% above the N33.947 billion reported in the corresponding period of 2024. Direct Cost of Sales is valued at N19.329 billion as against N13.211 billion in the similar periocd of last year. Operating Profit is N18.142 billion versus N12.877 billion, while Operating Expenses stood at N10.639 billion, higher than the N7.208 billion of last year by 47.60%. Profit before Tax is therefore estimated at N17.939 billion as against N12.294 billion in the comparable period. Tax Expense for the period is N4.482 billion versus N3.118 billion. Thus, Profit for the Period stood at N13.456 billion as against the N9.175 billion in the corresponding period.
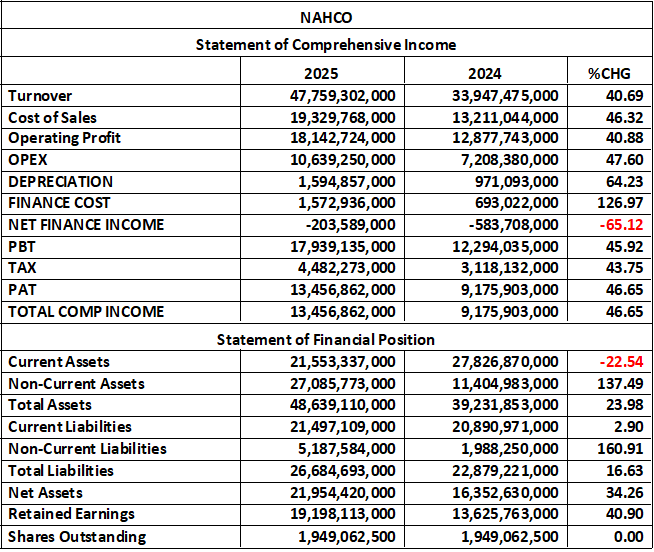
At the end of the period, the Current Assets of Nahco is estimated at N21.553 billion, Non-Current Assets stood at N27.085 billion, thus, Total Assets of Nahco is now valued at N48.639 billion versus N39.321 billion in the corresponding quarter. On the bottom line, Current Liabilities stood at N21.497 billion versus N20.890 billion. Non-Current Liabilities is N5.187 billion versus N1.988 billion, resulting to a Total Liabilities figure of N26.684 billion against N22.879 billion in the corresponding quarter. Nets Assets is therefore estimated at N21.954 billion versus N16.352 billion, while Retained Earnings stood at N19.198 billion from N13.625 billion. See the above table for details.
Financial Strength
- Debt Ratio dropped from 58.32% to 54.86% at the end of the quarter, meaning Nahco’s total liabilities now account for 54.86% of total assets, down from 58.32%. This we can be interpreted to mean that the company is slightly less leveraged than it was before now; just as it relies less on borrowed funds and more on internal financing (equity) for its operations. This decline suggests Improved financial stability, reduced credit risk, and better capacity to withstand the interest rate on FX shocks.
- Total Debt to Equity Ratio; the ratio moved from 139.91% to 121.55%, which is to say for every N1 of shareholders equity, Nahco owes N1.22 in debt (down from N1.40 previously estimated). This shows that leverage is still moderately high, only that the trend is improving. We can therefore say the company is managing its debt more prudently, possibly due to a higher retained earnings or profit reinvestment.
- Equity Ratio grew marginally to 45.14% from 41.68%, meaning that an estimated 45% of Nahco’s total assets is financed by shareholders’ equity, compared to 42% in the corresponding quarter. It is noteworthy that with rising equity ratio, the company’s solvency and financial independence are improving. This is a good sign for long-term investors.
In conclusion, Nahco’s financial structure has improved year-on-year as the company becomes less debt-dependent with stronger equity backing and reduced financial risk. This enhances its ability to fund operations internally, handle downturns, and attract investors. However, with a debt-to-Equity ratio still above 100%, it is necessary for management to continue balancing growth with prudent debt use to maintain flexibility and minimize exposure to interest and exchange rate volatility.

Profitability Ratios
- EBITDA Margin stood at 37.99% from 37.93%. This is virtually flat, although a slight improvement. NAHCO retains about N0.38 from every N1 of sales before non-cash and financing cost. The consistent operating efficiency shows that the company maintains strong cost discipline despite inflation and higher operating expenses in Nigeria’s aviation sector. Thus, we can say that operational performance is stable and efficient, indicating solid management control over expenses.
- Pre-Tax Margin: This ratio also improved marginally by 3.72% to 37.56% from 36.21%. Thus, Profit before Tax as a share of revenue increased by 1.35% points. Profitability improved even after taking interest and other non-operating costs into account. This reflects stronger earnings quality, better pricing power, higher traffic volumes, or cost containment at administrative levels.
- Cost of Sales to Turnover: This ratio moved slightly up to 40.47% from 38.92%. Direct Cost consumes slightly more of revenue now (a 1.55% increase). Thus, we say a small deterioration in cost efficiency, possibly due to higher fuel, maintenance, or import costs tied to naira devaluation and inflation. This needs close monitoring, as rising cost of sales could pressure margins if revenue growth slows.
- Return on Equity (ROE): This is currently estimated at 61.29% from 56.11% in the corresponding quarter. This means that, for every N1 of shareholders’ equity, NAHCO generated N0.61 in net profit. We can interpret this as: exceptionally strong and well above average for a Nigerian listed firm (typically in the region of 15-25%). High efficiency in using shareholders’ funds, either due to high profit margins, assets turnover, or moderate leverage. Investors’ capital is producing excellent returns.
- Returns on Assets Ratio Grew by 18.295 to 27.67% versus 23.39%. That is: for every N1 of total assets Nahco generated N0.28 profit, signaling a strong and improving asset productivity. The company’s assets are being used effectively to drive profits, confirming that asset investment (equipment, ground-handling tools, etc.) are yielding robust financial outcomes.
- Watch Point: Rising Cost of Sales could become a risk if inflation or Naira weakness continues. Sustaining these high returns requires reinvestment and cost control as expansion continues.
In conclusion on Profitability Ratios, we can safely deduce that Nahco is operating at a premium level of profitability, delivering industry-leading returns and maintaining operational stability despite macroeconomic challenges.

Efficiency Ratios
- Operating Expenses (Opex) to Turnover Ratio: Is currently estimated at 22.28% versus 21.23%. this mean that Operating Expenses now account for 22.28% of Total Revenue, this is up slightly from 21.23% in the last period. This indicates a small increase in administrative or overhead costs relative to revenue. Possible causes are: Rising Inflation, higher staff costs, or increased maintenance and logistics expenses (common in Nigeria’s aviation sector). While this is still very manageable, the upward trend means cost control must be watched closely to protect margins. Nevertheless, the positive aspect of this is that: the increase is marginal, and with profitability still strong (as seen in the earlier ratios), it is yet to erode earnings power.
- Turnover to Total Assets Ratio: This Ratio now stands at 98.19% versus 86.53%, meaning the company now generates N0.98 in revenue from every N1.00 of total assets, up from N0.87 in the corresponding period of 2024. This shows improved asset utilization, Nahco is using its fixed assets and resources more efficiently to produce sales. The implication is that: higher efficiency likely reflects increased flight activity, better equipment usage, and stronger demand for ground-handling services.
We can, therefore, safely conclude that: NAHCO is becoming more efficient in asset utilisation to drive sales, while maintaining tight (though slightly rising) operating cost control. The improvement in asset turnover enhances both ROA and overall profitability strength.

Investment Ratios
- Price at Released: At the time the result under review was released to the market, each share of Nahco was selling at N105, versus N38.90 in the corresponding quarter. This shows that the share price has nearly tripled, reflecting the strong investor confidence and robust demand. This sharp appreciation mirrors NAHCO’s robust earnings growth, improved profitability, and positive outlook. The market is re-rating Nahco upward, just as investors are now pricing in the higher future earnings potential as well as consistent performance.
- Earnings per Share (EPS): This followed an upward trend at N6.90, from N4.71, confirming that profit attributable to each share has grown significantly. This is a very positive sign, which reveals stronger bottom-line profitability and efficient cost management, reflecting both operational efficiency and good shareholders’ value creation.
- Price to Earnings Ratio: This ratio shows that: investors now pay N15.21 for every N1 of Nahco’s earnings indicating a level of market optimism, as investors expect continued earnings growth, hence are willing to pay a premium. Please note that: a rising P/E is positive when supported by strong fundamentals (as in Nahco’s case). However, it also means the stock is becoming less undervalued, moving from cheap to fairly valued or slightly expensive.
- Earnings Yield: Observe that a lower yield means the price has risen faster than earnings, which is typical of growth or momentum stocks. The implication is that: the drop from 12.10% to 6.58% suggests the market expects future earnings expansion, rather than immediate high income. The yield is respectable when compared to those of government securities (depending on current rates), but it signals less undervaluation.
- Book Value per Share: The company’s net asset backing per share increased by 34% reflecting a growth in shareholders’ equity through retained earnings and reinvestment. It should be noted that a rising BVPS confirms balance sheet strength and enhances intrinsic value, supporting long-term investor confidence.
- Nahco is transitioning from an undervalued stock to a growth and performance-driven equity. The stock is well positioned, but investors should monitor valuation levels as the P/E approaches the upper end of reasonable range (15x-18x for Nigerian equities).

Final Verdict:
NAHCO is a financially strong, highly profitable, and efficiently run company, showing rapid growth and increasing investor confidence. With reduced leverage, robust margins, record high ROE, and strong market revaluation, the company stands out as one of the most efficiently managed aviation service firms in Nigeria.
Nevertheless, there is a caution: The rising operating costs and a higher P/E ratio suggest that the stock is moving from undervalued for fairly valued, so sustaining growth and managing costs will be key going forward. Our recommendation is BUY.


