

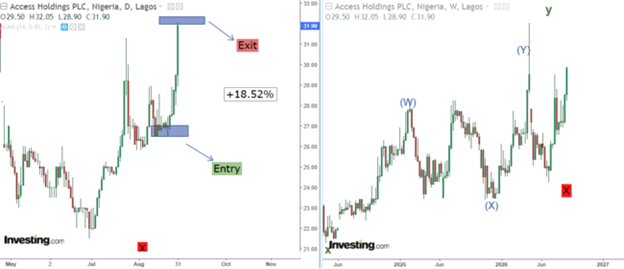
Current price range: N31 to N32
Rating: Sell
Next price projection: N33 and N36
Technical Analysis
In this report, we shall use the following tools and analysis methods:
Elliott’s wave theory to understand the overall market sentiment
Fibonacci tools to determine support and resistance levels
The Relative Strength Index and volume to evaluate the market’s strength
The Money Flow Index to determine the market liquidity
Moving average and MACD to understand the nature of the trend
Top-down analysis to know the best investment position
Elliott wave analysis
Daily chart: Entry point
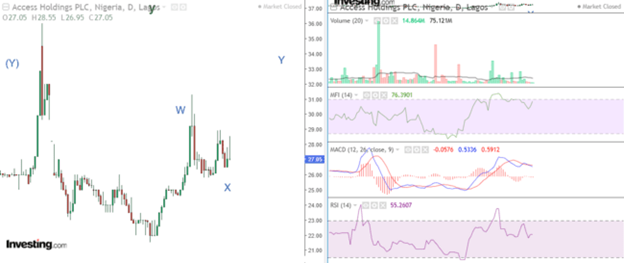
On August 17, 2026, Access Holdings was within its corrective wave X of the minor degree, characterized by low volume and strong bearish sentiment. However, the stock’s liquidity and momentum were strong, preparing investors for its bullish rally. Also, Access Holdings was at N27.05, with the price projected at N31 and N33.
Daily chart: Exit point
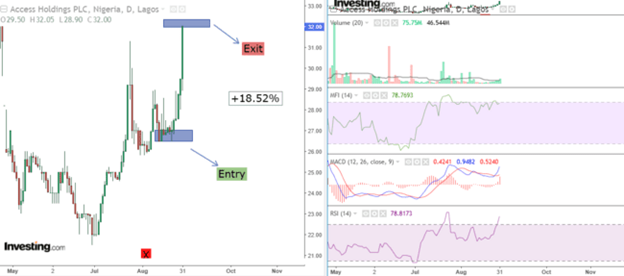
After two weeks, Access Holdings hit its first profit target at N31, offering an ROI of 18.52%. In other words, a trader who invested N500,000 should have an additional gain of N92,600. Currently, the stock’s volume, bullish momentum, and liquidity are strong, with potential for a continuous bullish rally.
Next Buy-in Opportunity
At the moment, investing in Access Holding may not yield a huge return on investment. Thus, investors should wait for a strong pullback to buy into value. For traders who bought at N27, this is a good time for profit-taking and holding. The next price projection is at N33 and N36.