Quarter Under Preview: 9-Months
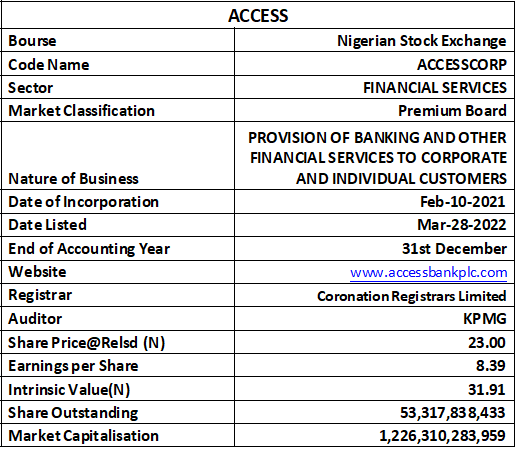
Current Share Price: N23.00
Price At Release Date: N23.00
Latest Final Dividend: N2.05
Latest Interim Dividend: N0.45
Estimated Beta Value: 0.53x
Estimated Intrinsic Value: N31.91
Analyst: Jeariogbe Tunde Segun
The Company
Access Holdings Plc is a non-operating Financial Holding Company and parent of Access Bank (‘the Bank’) and the related Group Entities that emerged from the court-sanctioned Scheme of Arrangement between the Bank and holders of its fully paid ordinary shares of 50 Kobo each. It was incorporated as a public limited liability company on 10 February 2021, and listed on the Nigerian Exchange premium board.
Access Holdings’ business segments comprise of deposit money banking, wealth and investment management, financial technology and ecosystem orchestration, while its operating and direct subsidiaries are Access Bank Plc (core banking), Hydrogen Payment Services Company Limited (payment services), Oxygen X Finance Company Limited (consumer lending) and Access Insurance Brokers Limited (insurance brokerage). Access Golf Limited is a Special Purpose Vehicle for Access Holdings equity investment in its indirect subsidiary, Access ARM Pension Limited (pension funds administration).
The Released Financials
At the end of the 2025 nine-month period, the management of Access Holdings reported a Gross Earnings of N3.901 trillion, which is 14.12% above the N3.418 trillion reported at the end of the similar quarter in 2024. Interest Income stood at N2.904 trillion versus N2.397 trillion in the prior nine-month. Interest Expenses is valued at N1.646 trillion, as against N1.553 trillion in the corresponding quarter of 2024.
Thus, Net Interest Income is estimated at N1.257 trillion, higher than the N844.841 billion of the similar period of last year. Operating Expenses increased slowly to stand at N1.072 trillion versus N1.016 trillion in the corresponding quarter. Having considered other expenses, Profit before Tax is valued at N616.248 billion against the prior nine-month’s N558.178 billion. Tax Expenses for the review period stood at N168.700 billion against the N100.432 billion of 2024, while Profit for the period is N447.548 billion, same as 2.23% below the profit of the corresponding quarter. Total Comprehensive Income stood at N159.881 billion versus N1.203 trillion achieved in the similar quarter of 2024. See the below table for details.
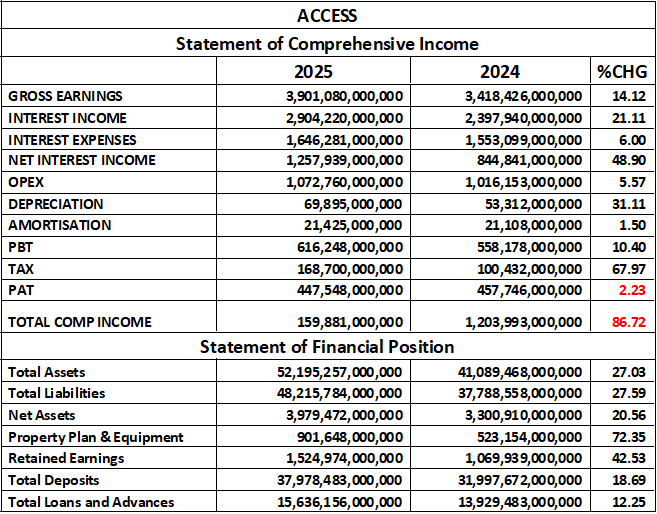
At the end of the quarter, the Total Assets of Access Holdings was valued at N52.195 trillion, up from N41.089 trillion at the end of last financial year ended December 31, 2024. Total Liabilities stood at N48.215 trillion versus N37.788 trillion at the end of 2023. Thus, Net Assets is estimated at N3.979 trillion versus N3.300 trillion. Retained Earnings improved by 42.53% to N1.524 trillion against N1.069 trillion. Total Deposit received through the period is valued at N37.978 trillion while the amount dispensed at Loans and Advances through the period is N15.636 trillion versus N13.929 trillion.
Financial Strength
- Debt Ratio: Access Holdings’ debt ratio means that over 92% of Total Assets are financed by liabilities, which is normal for banks/holding companies with a large banking arm. The slight increase from 91.97% to 92.38% indicates a marginal rise in leverage, meaning that the institution is relying more on borrowed funds.
It is noteworthy that high leverage is typical for banking groups. However, an upward movement signals increased liability growth relative to assets, requiring close monitoring to ensure liquidity remains strong.
- Total Debt to Equity Ratio: The estimated ratios as shown in the below table means the company now uses 12.12 Kobo of debt for every N1 of equity up from 11.45 kobo. Rising leverage indicates higher risk exposure, more pressure on capital adequacy, and potential vulnerability if assets quality weakens or interest expense rises. That notwithstanding, high leverage is normal for banks. Tthe key factor is whether earnings can support it.
- Equity Ratio: Equity now accounts for only 7.62% of total financing, dropping from 8.03%. This decline confirms that the balance sheet is becoming more debt-heavy and less equity buffered. A shrinking equity can weaken loss-absorbing capacity.
Final Verdict: Access Holdings’ financial strength is slightly weaker than the previous period. Leverage increased across all key measures, the equity cushion shrank, and liabilities now carry a larger share of asset funding. This is not unusual for banks, but the direction (more leverage, less equity) is a sign that the group needs to maintain strong profitability and capital planning to remain resilient.

Profitability Ratios
- EBITDA Margin: The Ratio declined slightly from 63.94% to 60.34%, indicating a weaker operating efficiency during the period.
- This could be due to
- Higher operating expenses
- Increased cost of risk (loan loss provisions)
- Pressure from FX revaluations or administrative costs
- Despite the drop, a 60% EBITDA Margin is still very strong for a financial institution
- Pretax Margin: Pretax profitability dipped from 16.33% to 15.80%, the decline mirrors pressure on the cost structure, meaning;
- Costs grew faster than revenue
- Or revenue did not expand strongly enough
Though this is marginal drop, but it shows mild tightening in profitability
- Interest Expense to Gross Earnings: This ratio improved significantly from 45.43% to 42.20%, this means Assess Holdings is spending less of its earnings on interest costs, including;
- Improved funding mix
- Cheaper deposit base
- Better repricing of assets versus liabilities
This is a strong positive, especially in a high-interest-rate environment.
- Return on Average Equity (ROAE): ROAE declined from 13.87% to 11.25%, this shows that shareholders equity earned lower returns even at the end of the nine months financial session. Possible drivers are;
- Lower net income (margin pressure/higher costs)
- Equity base growing faster than earnings
This aligns with the drop in ROAA and the slight increase in leverage. The bank is generating less return per unit of equity.
- Return on Average Assets (ROAA): ROAA decreased from 1.11% to 0.86%. This means the bank generated less profit per naira of assets. This is expected when;
- Asset growth is fast
- Margins tighten, or
- Loan impairment charges remain high
Please note that a lower ROAA is a signal that profitability per asset is slowing down.
Final Verdict on Profitability Ratios: Access Holdings’ profitability weakened moderately in the third quarter. EBITDA and Pretax Margins fell, ROAA and ROAE declined, indicating lower returns on both assets and equity. To offset this, interest expense as a share of gross earnings improved materially, which is positive for funding cost management.

Efficiency Ratios
- Operating Expenses to Gross Earnings Ratio: This ratio declined from 29.73% to 27.50%. This is a strong improvement in cost efficiency, and it indicates:
- Better cost control
- Possible digital process gains
- Scaling benefits as gross earnings increase faster than expenses
This ratio is moving in the right direction and offsets some of the earlier margin pressures.
- Gross Earnings to Total Assets fell from 8.32% to 7.47%, meaning that each Naira of assets is generating less gross earnings compared to the preceeding nine months. The decline suggests:
- Assets base expanded faster than revenue
- Lower yields on assets (e.g. slower loan growth or pressure on interest income)
This trend aligns with the earlier drop in ROAA, showing slight weakening in asset productivity.
- Loan-to-Deposit Ratio: LDR dropped from 43.53% to 41.17%, and can be interpreted as:
- Access is leading less aggressively relative to its deposit base
- More deposits are parked in other interest earning assets instead of loans
Consequently, a lower LDR can mean:
- Increased caution due to credit risk
- Strong deposit inflows without matching loan growth
- While conservative, it may limit earning potential if deposits are not deployed efficiently.
Final Verdict on Efficiency Ratio: Access Holdings is managing costs well, but asset utilization and lending aggressiveness have softened.

Investment Ratios
- Earnings per Share: EPS declined significantly from N12.88 to N8.38, a pointer to the weakness in core profitability which has been affected by:
- Lower pretax margins
- Higher operational and financing pressures
- Slower asset productivity
This sharp fall signals that the company’s earnings engine is under strain.
- Total Comprehensive Income: This ratio was affected by the following:
- Unrealized foreign currency translation difference which was negative as against the over N600 billion in the comparable quarter. This means:
- FX translation losses (likely from foreign subsidiaries or evaluation of FX positions) reduced OCI sharply
- Last year’s positive FX movements boosted OCI, this year the reverse happened.
- The second item is: fair value gain/loss on derecognized FVOCI debt securities (reclassified to P/L). This year was negative as against the nil figure of the corresponding quarter last year. This means that;
- The bank recorded fair value losses on financial instruments that affected OCI. Whereas, no similar losses occurred last year’
- These two factors severely reduced OCI causing Total Comprehensive Income per share to crash from N33.87 to N3.00. The fall is not mainly due to operating profit, but market and FX-driven valuation losses.
- Unrealized foreign currency translation difference which was negative as against the over N600 billion in the comparable quarter. This means:
- PE-Ratio: The PE-Ratio rose from 0.56x to 0.91x, this rise is explained by:
- Lower EPS (the denominator shrank), making the PE ratio automatically higher
- Despite rising, valuation remains extremely low, reflecting:
- Market skepticism
- High perceived risk and
- Very depressed earnings base
- Earnings Yield: Earnings Yield dropped from 59.07% to 36.50%, directly linked to the sharp fall in EPS. However, an Earnings Yield of 36.5% still shows deep undervaluation, suggesting the market may be pricing in:
- Higher risk
- FX uncertainties, and
- Lower forward earnings
- Book Value per Share: BVPS dropped from N92.87 to N74.64, this decline is perfectly consistent with the events on the items in the Total Comprehensive Income above. The impact of negative OCI is large enough to materially shrink shareholders value.

Final Verdict: Access Holdings’ nine months performance shows rising leverage, moderately weaker profitability, and mixed efficiency, but the biggest pressure came from unrealized FX losses and fair value losses, which heavily damaged comprehensive income and book value. Operationally, the bank remains strong, but its earnings quality and equity value were eroded by macro-economic and market driven factors. Valuation is still very attractive, but largely because the fundamentals have weakened.
In summary, Access Holdings remains robust in size and structure, but faces earnings pressure, weaker asset productivity, and significant OCI volatility. Strength lies in cost control and funding efficiency; weaknesses lie in FX exposure and declining returns.


