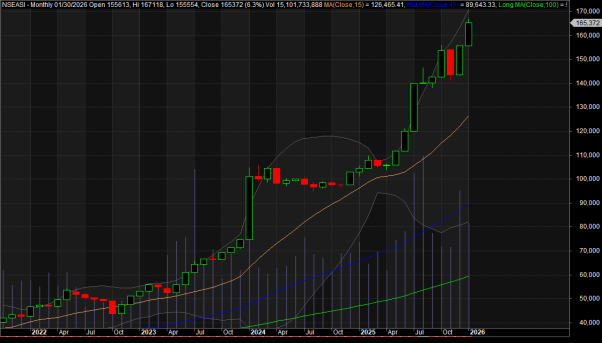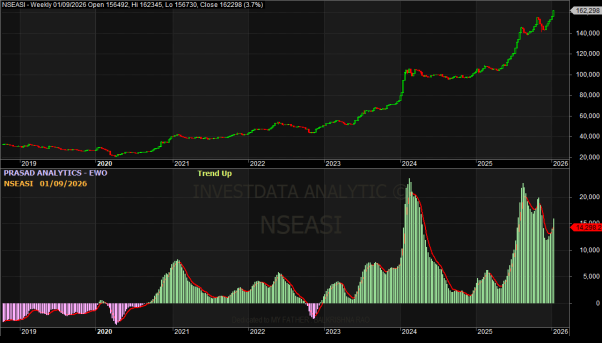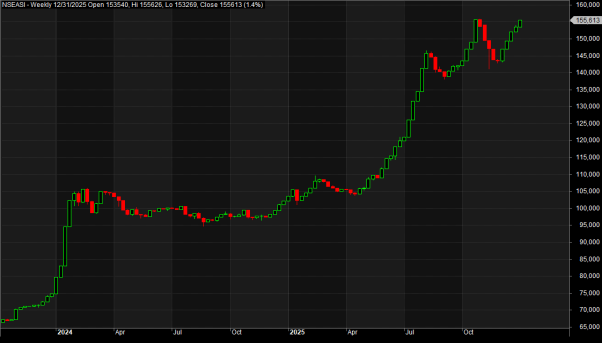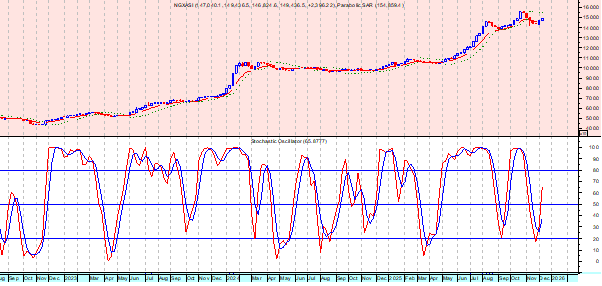
Candlestick charts at the end of trading last week revealed some very powerful truisms. The charts are based on the most consistent investment indicator in the world – human nature. Another investment truism is that if something does not work, it does not stay around for very long.
Candlestick analysis has been in existence for hundreds of years. Japanese rice traders have identified signals and patterns that produce high-probability results based on investor sentiments.
As an investor, whether a trader or a money/hedge fund manager applies the common sense expected results of candlestick signals and patterns significantly improve the ability to evaluate trend movement much more accurately. Candlestick signals and patterns are not conjecture, but they indicate the actual decisions occurring between the bulls and the bears.
The logic is simple: Candlestick analysis is the graphic depiction of everybody buying and selling during a specific time frame. It is not delegated to any specific trading market or entity. It is a graphic depiction of human nature. Anything that involves investor fear and greed, which is all trading entities, market indexes, stocks, commodities, currencies, or tulip bulbs, can be evaluated with much greater accuracy using candlestick analysis.
Investors can gain a considerable advantage by utilizing candlestick information to put ‘all the stars in alignment!’ First, the candlestick visuals will indicate reversals and the direction of the overall market trends. If the market reveals an uptrend, simple candlestick scanning techniques will reveal which sectors show the most vital signals. The same scanning techniques can then reveal which individual stocks demonstrate the most substantial upside potential in that sector. The same process can be used for identifying the strongest bearish sectors and bearish stock positions, in those sectors, in a market downtrend.
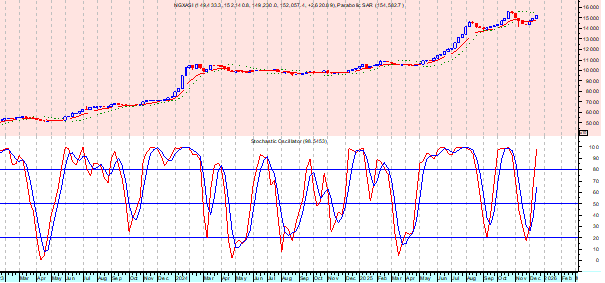
Chart 1 (Opening Chart)
At point “A”, identifying the candlestick buy signal, with stochastics showing oversold conditions, would warrant scanning for the sectors demonstrating the most robust bullish candlestick charts. The next step would be scanning for the individual stocks in those sectors, demonstrating the most vital bullish candlestick signals. This process implies that the sector is being bought across board by numerous buyers.
At point “B”, witnessing candlestick sell signals that sellers are taking control at a detectable resistance level. Sell signals at the resistance level and a close on top of the T line is a decisive probability factors that a downtrend is about to start.
Also, look at the candlestick charts or price actions below.
GTCO
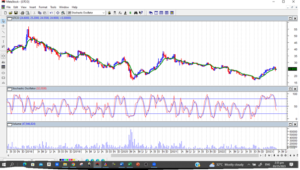
ZENITH BANK

UBA

FCMB
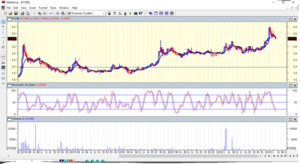
FBNH
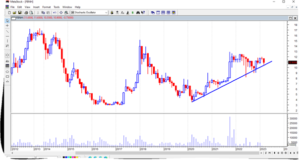
STANBIC IBTC

ETI
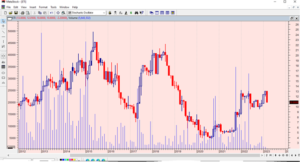
ACCESSCORP
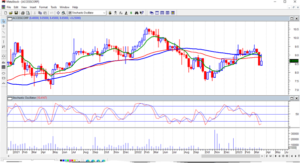
STERLING BANK

FIDELITY BANK

JAIZ BANK


