Quarter Under Review: 9-Months
Current Share Price: N17.00
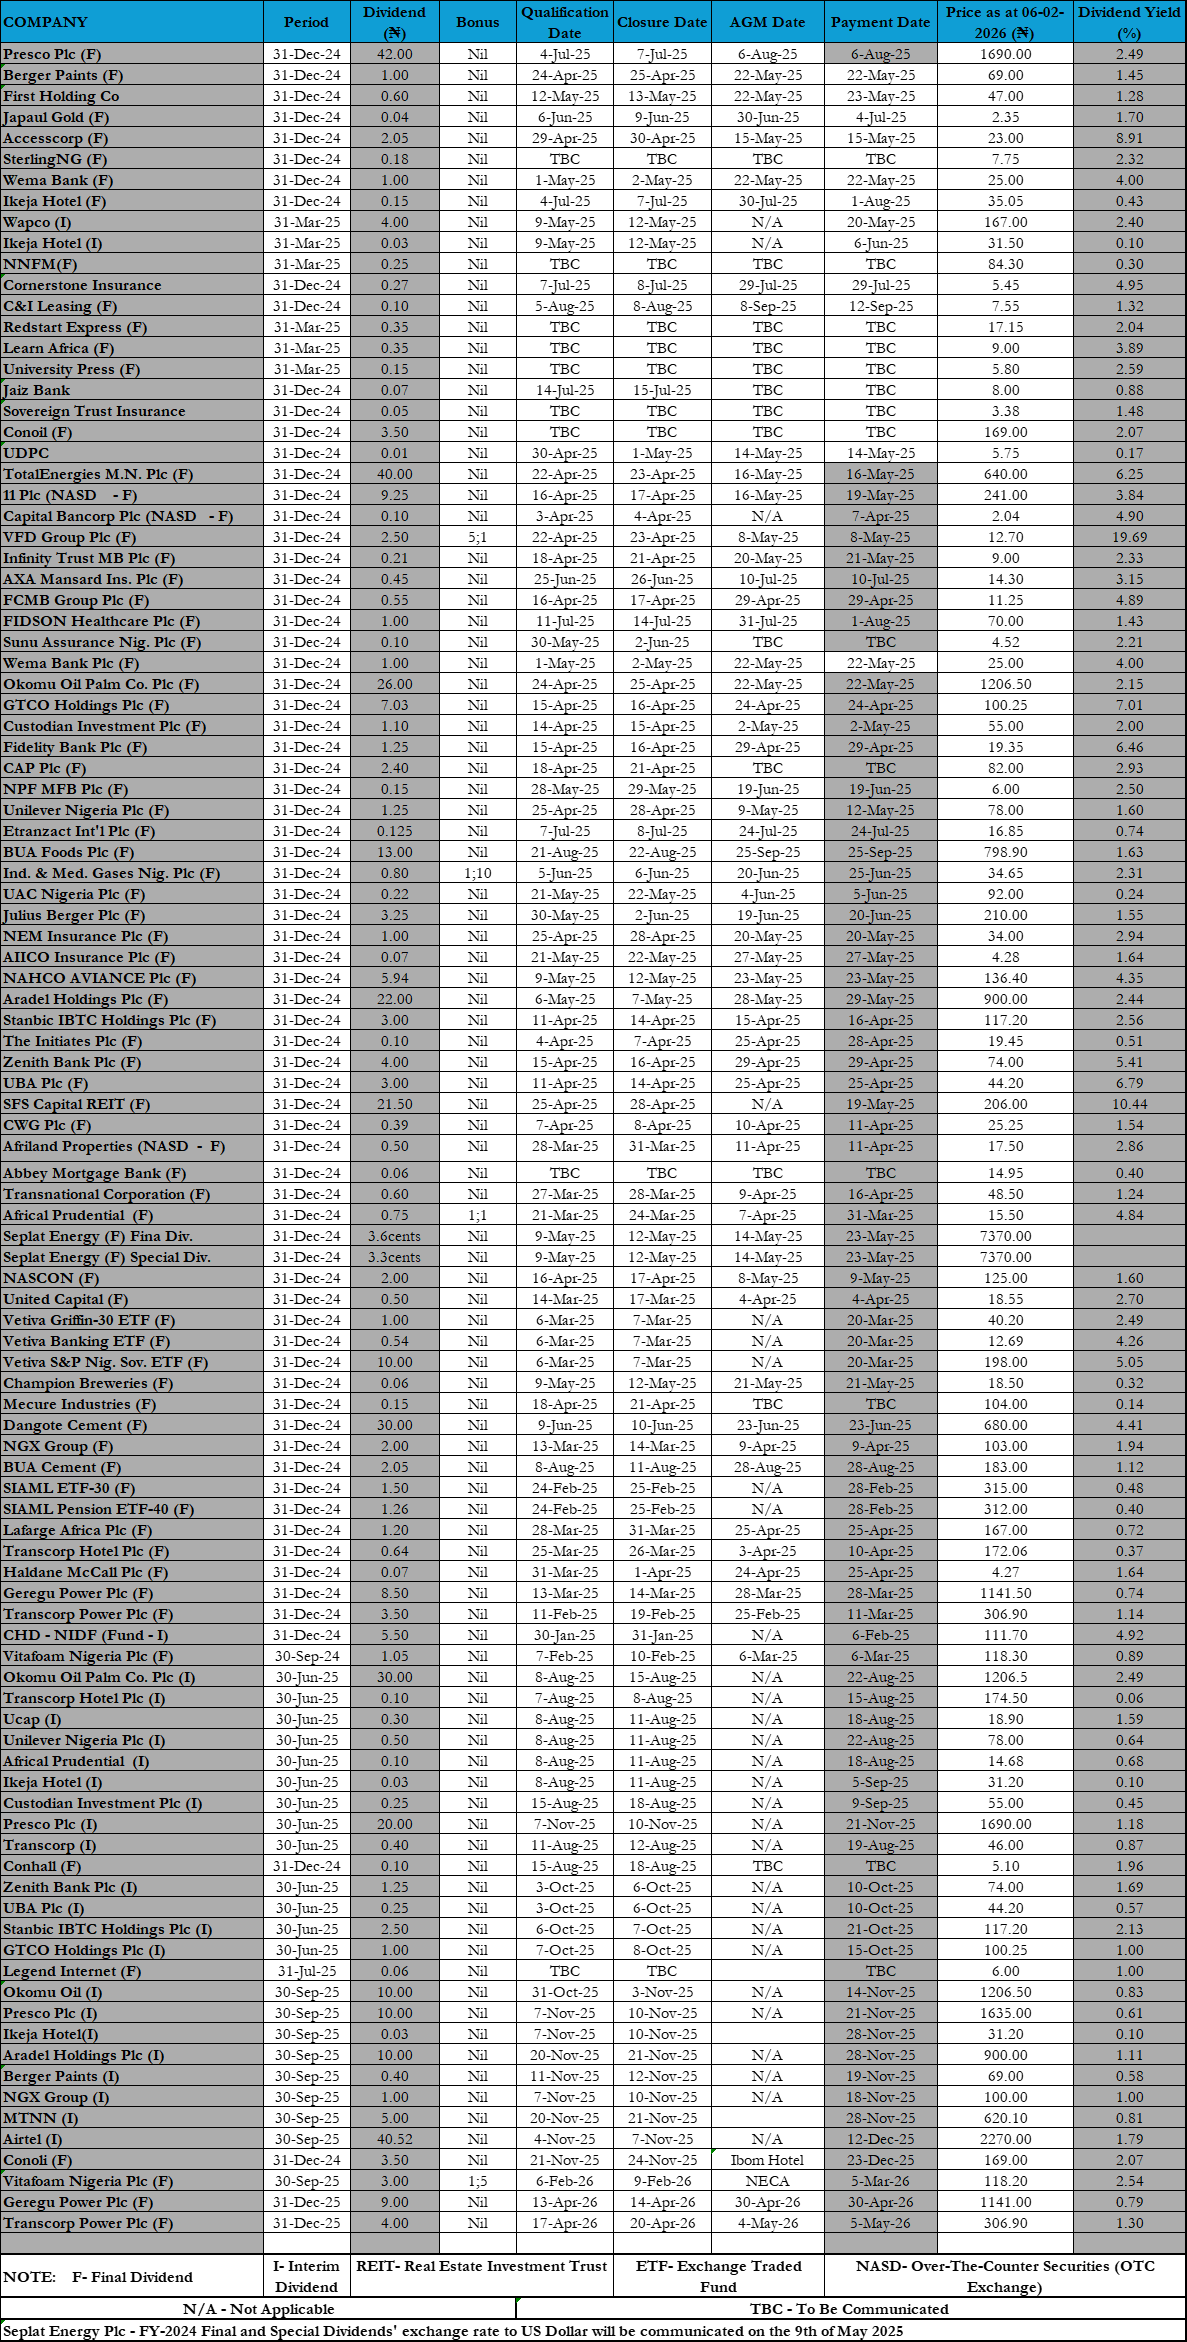
Latest Final Dividend: N0.39
Latest Interim Dividend: Nil
Estimated Beta Value: 0.05x
Estimated Fair Value: N9.96
Estimated Intrinsic Value: N7.76
Analyst: Jeariogbe Tunde Segun
The Company
CWG is a Pan-African systems solutions company which specializes in a wide array of IT services including: communications, and integration services, infrastructure services, managed and support services, cloud services, and software.
CWG commenced operations in Nigeria on September 26, 1992, as Computer Warehouse Limited (and later Computer Warehouse Group), principally catering to computer hardware projects. Few years later, DCC Networks was established as the communication arm to provide VSAT, Metropolitan, Wide Area and Local Area Networks to corporate organizations. Further expansion led to the establishment of a branch in Ghana in 2003 to cater for the needs of the broader West African region.
In 2005, Computer Warehouse Group was incorporated to co-ordinate and monitor the activities of its three subsidiary companies (CWL, DCC and Expert Edge).
On November 15, 2013, Computer Warehouse Group listed its shares on the Nigerian Stock Exchange (NSE) which is today Nigerian Exchange (NGX) Limited, following which it transformed from a Private Limited Company and was listed as a public company.

The Released Financials
During its operations for the first nine months of 2025, CWG Plc announced a Turnover (TO) of N48.936 billion, which was 40.68% higher than the N34.785 billion posted at the end of the corresponding period 2024. The Direct Cost of Sales in the same period was estimated at N36.784 billion, versus N27.746 billion in the corresponding period of last year. Operating Expenses through the season is valued at N5.921 billion, against N3.895 billion in the similar period of 2024. Finance Cost through the full period is N99.380 million, versus N89.629 million, Net Finance Income for the period was negative as Finance Incomes stood below the Cost. Profit before Tax stood at N6.248 billion versus N2.999 billion in the corresponding quarter. Tax Expenses reported is N1.499 billion, resulting in Net Profit of N4.749 billion, which is over 100% higher than the N2.279 billion achieved at the end of last year’s first nine months business session. See the below table for details:

At the end of the period under analysis, the Current Assets of CWG Plc was estimated at N46.436 billion, while the Non-Current Assets is N1.926 billion, versus N137.994 million at the of 2024. Thus, Total Assets at the end of the period is valued at N48.362 billion, against N36.133 billion of the corresponding quarter. Current Liabilities of CWG at the end of the period is N40.033 billion against N32.610 billion in the comparable period, while Non-Current Liabilities stood at N75.250 million against N137.999 million of the previous quarter. Thus, Total Liabilities of CWG at the end of the period is valued at N40.108 billion. On the strength of these, the Net Assets is estimated at N8.254 billion versus N4.716 billion, while Retained Earnings grew by 169.38% to N7.203 billion, from N2.673 billion. See the above table for details:
Financial Ratios
- Debt Ratio: CWG’s debt ratio has decreased within the period under review, meaning that Total Liabilities now represent a smaller proportion of Total Assets than it was last year. This shows:
- Reduced financial leverage
- Less reliance on external borrowing, and
- Improved stability to cover obligations with assets
While still high, the downward trend is positive for financial stability.
- Total Debt to Equity Ratio: Total Debt to Equity has fallen sharply, meaning;
- The company has strengthened its equity base and/or reduced debt level
- Although CWG remains highly leveraged, the decrease shows improving solvency
- A lower debt-to-equity ratio reduces financial risk and interest burden
- Equity Ratio: Equity as a percentage of Total Assets has increased, which means:
- Shareholders now fund a larger portion of the company’s assets
- This supports long-term sustainability
- Combined with the falling debt ratios, this indicates improving capital structure.

Profitability Ratios
- EBITDA Margin: This ratio shows an improved efficiency in the company’s management capactuy, and higher-quality revenue stream. The company recorded a strong improvement in operating profitability.
The EBITDA margin expanded by over 400 basis points, indicating a better cost management, stronger topline performance, and improved operational efficiency. This is an indication that the core business is generating more cash profit per Naira earned as revenue than it did last year. We are of the opinion that this is a very positive signal for the company.
- Pre-Tax Margin: The Pre-Tax Margin also increased significantly, reflecting not just a stronger operating profit, but better control of financing costs, lower non-operating expenses, or one-off gains. It shows CWG is retaining more income at the bottom before tax.
- Cost of Sales to Turnover: A meaningful drop in cost-to-revenue ratio means CWG is spending less to generate each unit of revenue compared to last year. The reduction likely comes from:
- Improved procurement, or supply chain efficiency
- Higher margin service lines
- Better pricing power.
This directly supports the improved EBITDA and pretax margins.
- Return on Average Equity (ROAE): This is an exceptionally strong ROE. CWG is generating N0.58 profit for every N1 of shareholders equity, higher than the previous year. A rising ROAE indicates:
- Strong profitability
- Efficient use of shareholders’ funds
- Possibly a relatively small equity base leveraged to generate higher returns
This level of ROAE is well above industry average, showing high capital efficiency.
- Return on Average Assets: This showed another strong improvement. An increasing ROAA is an indication that CWG is using its total assets base more efficiently to generate profit. The improvement reflects better asset turnover, improved margins, or both.
We can safely conclude that overall, profitability is robust, expanding, and pointing to healthier operations and stronger value creation for shareholders.
Efficiency Ratios
- Operating Expenses (OPEX) to Turnover: Operating expenses increased slightly relative to revenue as shown in the table below.
This ratio rose by about 0.9 percentage points, indicating that CWG spent a little more on administrative, selling, and general operating activities when compared to last year. However, the increase is moderate, and given the strong improvements in the EBITDA and Pretax margins, this rise does not in any way signal inefficiency. Instead, it could reflect:
- Higher manpower, or expansion-related expenses
- Increased marketing or distribution costs, and
- Inflationary pressure on operating costs
Since other profitability indicators moved upward, this ratio is not a major concern, as it simply shows that the company is investing slightly more to sustain growth.
- Turnover to Total Assets: This is a strong improvement in asset utilization. A turnover-to-asset ratio above 100% means CWG is generating more than N1 revenue per N1 of total assets. This is very efficient and indicates:
- Better use of existing assets
- Possibly higher revenue from the same asset base
- Improved business activity and operational productivity
The increase from 96.27% to 101.19% suggests CWG has become more effective at converting assets into revenue. We therefore conclude that, overall, efficiency is healthy, with asset utilization being the standout strength.

Investment/Valuation Ratios
- Earnings per Share (EPS): EPS has more than doubled, showing very strong profit growth attributable to shareholders. This indicates:
- Strong operational improvement
- Better profitability, and
- Higher value creation per share
This is a highly positive signal for investors.
- PE-Ratios: the PE ratio has increased, meaning;
- Investors are now willing to pay more for each N1 of earnings
- Market confidence in CWG has improved, and
- The stock is becoming more fairly valued due to stronger earnings expectations
However, 8.93x is still relatively low and it suggests that the stock may remain undervalued compared to its earnings growth.
- Earnings Yield: Earnings Yield dropped slightly because the share price has risen faster than earnings. This is not a negative sign, as it actually reflects:
- Higher market valuation
- Increased investor demand for the stock, and
- A translation from deep undervaluation to more balanced valuation
Earnings yield above 10% is still very attractive.
- Book Value per Share: Book Value per share has grown sharply, showing:
- Better retained earnings
- Strengthening shareholders’ equity, and
- A healthier balance sheets
This supports long-term stability and investor confidence.
- Price-to-Book Value: The Price to Book has increased significantly, meaning;
- The market is valuing CWG well above its asset base
- Investors expect higher future growth, and
- The company’s intangible factors (brand, digital services, market positioning) are being priced in.
A high Price to Book is not negative for tech/service companies, because these businesses often command higher multiples because their value comes from technology, expertise, and scalable services rather than fixed assets. We can therefore conclude that, CWG appears to be a growing, and increasingly priced stock given its strong financial performance.
General/Final Verdict on CWG Numbers/Ratios
CWG Plc is performing strongly across all key financial dimensions. Profitability is robust with expanding margins and very high ROE/ROA. Efficiency is solid, with excellent asset utilization despite a slight rise in operating expenses. Financial strength is improving, with lower leverage and a growing equity base. From an investment perspective, earnings growth is strong, equity per share is increasing, and market valuation is rising in line with performance, while still offering attractive earnings yield. On the strength of all of these, we conclude that CWG is well-positioned operationally and financially, showing solid growth and shareholder value creation. Thus, our Rating is Buy/Accumulate.


