Company: FBN HOLDINGS PLC
Rating: HOLD
Current Market Price: N5.30
LDR (Q3-2019):57.20%
Year High: N9.00
Year Low: N4.35
Fair Value: N7.95
Equity Analyst: Tunde Segun Jeariogbe
Introduction
• We have carefully observed the recently released nine-month financials of company FBN Holdings Plc, and compared same with figures released in the similar period of 2018 to establish growth and make recommendations accordingly.
• We note that FBNH stayed very close to the regulatory benchmark set for the Loan to Deposit (LDR) ratio of 60% in the period under review. Estimates from the released numbers confirmed that the group achieved 57.20% LDR, 2.8% below the set ratio.
• A further probe of the figures shows that the various performance indices however continue to struggle, with the group managing to rebuild its bottom line, after recording a marginal decrease in its top line.

Company figures
• Gross Earnings at the end of the nine months is estimated at N443.09 billion, which is slightly below the N445.89 billion estimated in the corresponding period of 2018.
• Interest Income also fell 2.99% below the comparable period, at N327.46 billion, as against N337.55 billion.
• Meanwhile, the management successfully kept Interest Expense flat within the two periods compared in this report.
• As a result of the marginal difference in both Interest elements, the Net Interest Income dipped by just 4.55% to N211.43 billion, as against the N221.52 billion in the corresponding period of 2018.
• Operating Expenses are estimated at N200.19 billion, same as 16.46% above the N171.90 billion stated in its 2018 third-quarter earnings numbers.
• Profit before Tax stood at N60.02 billion, an improvement over the N51.34 billion achieved in 2018 the nine months financials.
• After making provisions for Tax Expense, Profit reported for the period was N51.83 billion, which is 15.46% above the N44.89 billion reported in the similar period of 2018.
• Boosted by Unrealised net gains arising during the period from equities, Total Comprehensive Income soared by 131.64% to N83.79 billion, as against the N36.17 billion stated in its 2018 third-quarter report.

• Total Assets is currently valued at N5.73 trillion, a marginal improvement over the previously estimated N5.34 trillion.
• Total Liabilities, on the other hand, grew by 10.26% to stand at N5.12 trillion compared with the N4.65 trillion estimated for December 31, 2018.
• Thus, Net Assets dipped by 13.04% at the current value of N604.92 billion, from N695.61 billion at the end of 2018.
• Retained Earnings dropped by 75.06% to the current N43.06 billion, as against N172.69 billion last year.
• Total Deposit also climbed to N4.51 trillion, from N4.01 trillion at the end of 2018.
• Total Loans and Advances inched down by 4.82% to stand at the current N2.58 trillion compared to the previous N2.71 trillion
Financial Strength/Solvency Ratios
• We have estimated the Debt Ratio at 0.89x as against 0.87x last year, implying an improved asset valuation against last year. Please note that Total Deposits were added to the Liabilities figure used in the estimates.
• We also ascertained that the Total Debt for the period can replicate Equity 8.48 times, which is an improved position from the 6.69 times estimated from the 2018 third quarter statistics.
• Total Equity was estimated at 11% of the Asset Value at the end of the period, a lower position of 18.90%, over the 13% estimated in the corresponding period.
• We have currently estimated a Beta value above the market Beta for FBNH. Please note that at 1.79 beta value, it’s still above the industry average of 1.56.

Profitability Ratios
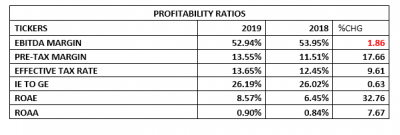
• EBITDA for the period under review is currently estimated at 52.94%, a 1.86% drop from the previously estimated 53.95% in 2018.
• Pre-Tax Margin stood at 13.55% up from the last estimate of 11.51% at the end of the 2018 nine-month business session.
• Tax Rate Provision was stable through the two periods compared in this report. See the table below for details
• Interest Expense figure posted for the period is the same as 26.19% of the Estimated Gross Earnings figure; this is a flat position against last year’s ratio.
• Return Achieved on Average Equity used through the period was estimated at 8.57% this is above the 6.45% return achieved in 2018
• See the table below for detailed profitability ratios and comparison.

Efficiency Ratios
• Operating Expense is estimated to be 45.18% of the Gross Earnings Value estimated for the period, this is a marginal growth from the 38.55% estimated from 2018 financial statistics.
• Similarly, Gross Earnings was estimated to be 7.73% of Total Assets, this is a 7.33% drop in efficiency when compared to estimate from the corresponding period.
• Total Loan to Deposit Ratio achieved at the end of the quarter stood at 57.20% down from the 67.63% achieved in 2018. Please note that this is below the CBN mandated 60% which was to be achieved at the end of the period covered by this report.

Investment/Valuation Ratios
• Returns on each unit of FBN Holdings Plc at the end of the quarter had been estimated at N1.44, from the previously estimated N1.25 each.
• Total Comprehensive Income per unit is estimated at N2.33, versus N1.01 in the corresponding period of 2018.
• Price to Earnings Ratio adjusted per quarter stood at 1.22x, as against 2.50x in 2018.
• The said earnings per share is same as 27.25% of the current market price of FBN Holdings Plc shares on the floor of the exchange when the result was released this is a better yield when compared to the previous quarter estimate
• However, the current Book Value of FBN Holdings Plc is N16.85, a 13.04% drop from the N19.38 estimated last year
• Confirming a seemingly under-priced position is the Price to Book Value ratio that stood clearly below unity.

Valuation
We adjusted down of fair value for each unit of FBN Holdings Plc’s shares to N7.95from the previous N10.11. Please understand that our valuation is favourable to investors and is open for review twice every year, depending on improvement seen in valuation metrics per quarter. Thus, considering the mild difference between our intrinsic value and the current market price of FBN Holdings, we have rated the stock a Hold.


