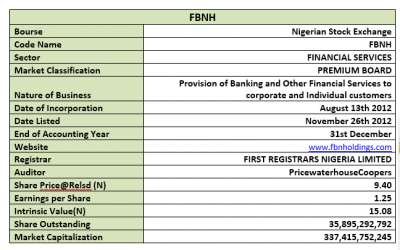
Coy: FBN Holdings Plc
Rating: Buy
Current Market Price: N7.50
NPL RATIO (Q2-2018): 20.8%
Year High: N15.16
Year Low: N7.50
Fair Value: N15.08
By: Jeariogbe Tunde Segun (Equity Analyst)
Key Financial Ratios
• In this report we have observed the nine-month financials of FBN Holdings Plc for the period ended September 30, 2018, and compared same with the corresponding quarter of 2017 to ascertain growth, strength and performances, thereby predicting possibilities in the full year earnings.
• As noted above the Non-performing loan ratio of FBN Holdings Plc as at the close of half year business was 20.8%. This is on the high side, especially when compared with estimates from industrial peers
• Comparing the released statistics with that of corresponding quarter of 2017, it was established that key performance ratios fairly improved.
• Observing the released statistics, it was observed that Gross Earnings only recorded marginal growth, while Interest Income stemmed below comparable period. Please understand that only few items such as Fees and Commission incomes and Net Gains on Foreign Exchange helped the year’s profit.

Company Figures
• Gross earnings for the period only improved by 1.02% above what was reported in 2017 Q3. A total of N445.89 billion was reported for the nine months as against the previous N441.31 billion.
• Interest Income stood at 5.20% below 2017 figure. Current Interest Income is N337.55 billion, lower than the N356.07 billion posted in 2017 nine months result.
• Meanwhile, Interest Expenses grew by 14.06%, having moved from the previous N101.73 billion to N116.03 billion.
• Profit before Tax currently reported is N51.34 billion, this is 7.38% below the N55.43 billion of 2017.
• The current profit as reported for the period stood mildly below that of 2017 nine months. The current profit for the year is N44.89 billion as against N45.00 billion in similar period of 2017. This is only a 0.23% difference.
• Total comprehensive income dipped by 35.80% to N36.17 billion as against N56.35 billion in previous third quarter.
• Total Assets is currently estimated at N5.347 trillion, same as 9.95% above the N4.863 trillion estimate of the previous quarter.
• Total Liabilities is currently estimated at N4.652 trillion that is 9.91% above the N4.232 trillion reported in corresponding quarter of 2017.
• Total Deposit through the nine months is estimated at N4.016 trillion, which is 13.29% above the N3.545 trillion achieved in the first nine months of 2017.
• Meanwhile, Loans and Advances slightly improved over comparable period in 2017 by 1.52%. According to the report a total of N2.715 trillion was given out as loans and advances through the period this is above the N2.675 trillion of 2017.
• Nevertheless, Net Assets improved by 10.23% when compared to the reported figure in similar period of 2017.
• Kindly see the table below for details.

Volatility Ratios
• Confirming the spread of FBNH shares amongst the investing public, estimated beta value stood well above unity and industry average. See the below table for details
• We estimate Debt to Equity ratio for FBN Holdings at 61.30% is well below the industry average of 170.31%. (Kindly note that industrial peers are holdings companies as FBNH).

Profitability Ratios
• Interest Expense to Gross Earnings is presently estimated at 26.02%, or 12.91% higher than the 23.05% estimated in 2017 nine months financials.
• PBT margin stood at 11.51% as against 12.56% last year, this is 8.32% lower than the 2017 estimate.
• Similarly, Profit margin dipped mildly against last year’s estimates. We have estimated 10.07% margin from Gross Earnings as against the previous estimate of 10.20%.
• Return on Average Equity is now 6.45%, compared to the 7.13% returns achieved in the first nine months of 2017.
• Return on Average Assets dipped against comparable period by 9.26%, moving from 0.93% to 0.84%

Efficiency Ratio
• Gross Earnings to Total Assets is estimated at 8.34% this is 8.12% below the estimate in 2017
• Similarly, Gross Earnings to Equity is now 64.10% as against the 69.95% estimated from 2017 nine months financial statistics.
• Financial Leverage is 7.69x as against 7.71x, this is an estimate of the number of times the total assets replicates the equity. In this case, it is a marginal reduction.
• It was also established that 67.63% of the Total Deposit was given out as Loan and Advances during the period under estimate this is 10.39% lower than the 75.47% given out during the first nine months of 2017.
• Meanwhile, Loan and Advances is same as 50.79% of the Total Assets, this is 7.67% lower than the 55.00% estimated for the corresponding quarter of 2017. This shows a controlled/reduced risk compared to 2017.

Investment Ratios
• Just as in the company report above, since shares outstanding remained constant during the two periods under consideration, the estimated amount earned per unit of FBNH is N1.25, which is 0.23% below the N1.25 earned last year.
• The Total Comprehensive Income per share for the period is N1.01, below the N1.57posted in 2017 nine months financials, this is 35.80% difference.
• The said Earnings Per Share yielded 13.31% of the current market price on the day the result was made available to the investing public. This is poor yield when compared to the 20.39% achieved last Q3.
• Please understand that the mild growth accounts for the poor yield estimate, since the investing public already priced each unit of FBNH shares higher that what it was in the corresponding period of 2017. (Current SP:9.40, Previous SP:N6.15).
• P/E Ratio for the period is 2.50x, as against 1.63x estimated last year. This is an indicator of positive investors’ sentiments
• As we speak the Book Value of FBNH is N19.38 above the N17.58 estimated last year.
• Opex Margin equally recorded mild improvement of 5.54% having moved to 38.55% from 36.53%

Valuation
After carefully utilizing our blend of valuation models, we have conservatively valued each units of FBNH Plc at N15.08. Thus, considering the current market price of N7.50 (as at the time this report was concluded), we Rate FBNH shares a Buy.
Please note carefully that we do not expect very strong improvements in its full year financials. Nevertheless, we foresee better returns from the Holdco if the management close up on few key ratios, by working hard to improve its stake in the various sectors of play. On this strength, our Rating Stand will fit best for long term investment positions.


