FNB Holdings (FBNH) Plc recently released its long-awaited unaudited financial statements for the period-ended 31 March (3M-22) 2022 to the market.
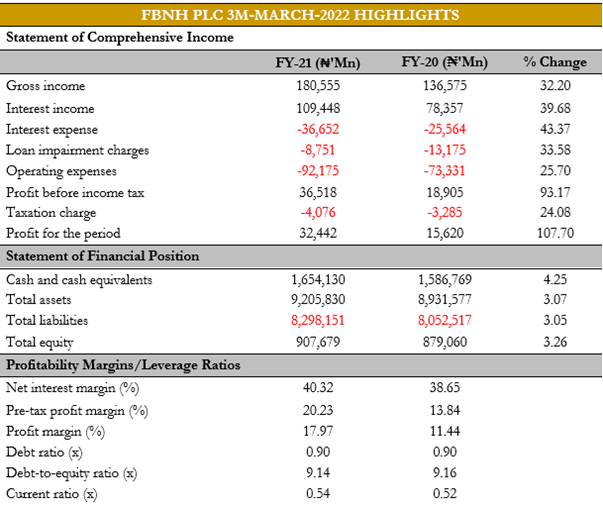
A close analysis of the results showed that both Gross Income (GI) and Profit After Tax (PAT) expanded by 32.2% and 107.7% to settle at ₦180.56 billion and ₦32.44 billion respectively compared to the numbers achieved in 3M-2021.
Expansion in loan portfolio key to GI growth
The growth in GI was bolstered by improved year-on-year (y/y) growth in Net Interest Income (NII), specifically, Interest income following substantial growth in customer loans during the period. However, Interest expense grew by 43.4% y/y, driven by 72.7% rise in Interest on customer deposits as the group grew term deposits more than Current and Savings Account (CASA) deposits. The slight weakening in CASA mix to 81.8% (FY-21: 82.8%) led to a 36bps y/y increase in the Group’s cost of funds to 2.0%. Nonetheless, the NII grew by 37.9% y/y with the Net Interest Margin (NIM) expanding by 20bps to 5.4%.
Trading income bolsters NIC
Non-interest income (NIC) grew by 23.0% y/y in 3M-22 amid a 254.2% surge in Trading income. The key driver on this line was gains from financial instruments at fair value through profit or loss (FVTPL) which came in at ₦15.86 billion in the 3M-22 compared to ₦2.88 billion achieved in 3M-21.
Sticky expenses amid challenging operating environment
Operating expenses (OPEX) expanded by 25.7% y/y, mostly on regulatory costs and maintenance expenses. However, following the larger growth in Net income (+30.5% y/y) than OPEX expansion, operating efficiency improved, with the Cost-to-Income ratio falling to 67.1% (3M-21: 69.6%). As such, Pre-provision operating profits grew by 41.3% y/y. Further down the P&L, Loan loss provisions fell by 33.6% y/y (Cost of Risk fell to 1.1% vs 2.3% in 3M-21), while the Group recorded ₦72.05 million loss of its shares in Associate’s investment.
Improved NIN and NIC bolsters bottom lines
In line with improved NII and NIC, the Group’s Pre-tax profit in the 3M-22 rose by 93.2% y/y to settle at N36.52bn. Although, total tax expenses rose to ₦46.66 billion, representing 24.1% upside of 3M-2021 number, however Post-tax profit (PAT) expanded by 107.7% to settle at ₦32.44 billion from ₦15.62 billion in 3M-2021. Based on outstanding shares of 35.9 billion, our computed 3M-22 earnings per share (EPS) stands at 90kobo, 46kobo higher than 44kobo reported in 3M-2021, leading to a Price/Earnings Ratio (PE) of 10.78x against the closing market price of ₦9.70 posted on Friday, 17 June 2022.
Balance sheet restructuring now yielding fruit
Asset quality trends remained positive, as the Group’s NPL ratio improved to 6.0% (FY-21: 6.1%; 3M-21:7.9%). Although this ratio is still above the regulatory limit, we note that this is a significant improvement from 3 years ago when the NPL ratio was at 25.9%. Notably, a 6.0% NPL ratio is at par with Guaranty Trust Holdco’s (GTCO) NPL ratio (3M-22: 6.0%).
Investment case for FBNH
The Group’s strong start to the year is encouraging, bolstered by substantial growth in customer loans. If the pace of growth is sustained, combined with the rising yields in the Fixed Income, following the MPC recent hike of MPR by 150bps to 13.0%, we may likely see an improve performance in quarters ahead.
Following the episodic upward rally in the FBNH’s share price late 2021 and in Q2-2022, driven by struggle for control over the Group’s board in our view, the current market price does not reflect the Group’s fundamental value as it is currently elevated. As a result, we maintain our SELL recommendation on the stock.


