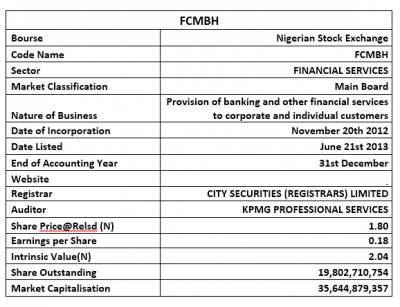
Coy: FCMB Holdings Plc
Rating: Hold
Current Market Price: N1.80
NPL RATIO (Q4-2018): 5.90%
NPL RATIO (Q4-2017): 4.92%
Year High: N2.65
Year Low: N1.54
Fair Value: N2.04
Equity Analyst: Jeariogbe Tunde Segun
Key Investment Ratios
• This report observed the financial performance indices of FCMB Holdings for the period ended 31st March 2018, compared the same to released statistics for the similar period in 2018 and established growth. We have also valued the stock using the last full year financials along with few other trailing ratios
• As noted above, the Non-Performing Loan (NPL) at the end of the 2018 financial activities is estimated at 5.90% (Gross Loans: N681.326 billion; and NPL: N40.195 billion), representing 19.92% rise over the estimated NPL Ratio of 2017 (Gross Loans: N675.101 billion and NPL: N33.221 billion).
• Though the risk growth could be regarded as marginal, it is, however, more desirable that the ratio reduces on a yearly basis.
• A summary of the performance shows fair improvements in the holding company’s financial indices through the first three months of the year, compared to a similar period in 2018. See below for our comparison.
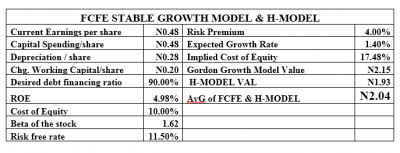
• We have fairly valued each unit of FCMB Holdings at N2.04, which is 13.33% above market valuation as at the time of the report was released and 78.50% below the estimated Book Value per share at the end of the quarter. We have therefore rated it a Hold.
Company figures
• Gross Earnings reported for the period stood at N43.90 billion, this is 4.11% growth over the N42.17 billion posted in the same period of 2019.
• Interest Income builds by 5.38% to currently stand at N34.40 billion as against N32.64 billion in 2018 first quarter.
• Similarly, Interest Expense climbed above the comparable period by 5.97% to stand at N15.78 billion from the previously reported N14.89 billion.
• Total Operating Income, therefore, stood at N2.74 billion, as against the estimated N3.27 billion in 2018 financials. The reduction was due to its higher estimated income from financial income in the 2018 financials.
• Operating Expenses appreciated by 12.37% to N18.35 billion, compared to N16.33 billion posted in the same period of 2018.
• Profit before Tax jerked up to N4.29 billion, this is 31.93% above the N3.25 billion estimated in 2018 first quarter financial performance.
• In the same trend, Profit for the period stood at N3.61 billion, same as 39.89% above the N2.58 billion profit achieved in the similar period of 2018
• After considering other comprehensive incomes, the Total Comprehensive income for the period is estimated at N4.51 billion, as against the N2.80 billion stated at the end of 2018 first quarter.
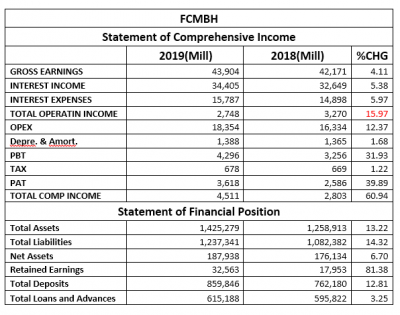
• Total Assets Turnover improved over the comparable period by 13.22% at the current estimate of N1.42 trillion, as against N1.25 trillion of 2018 Q1
• Total Liabilities equally improved by 14.32%, moving from the previous N1.08 billion to the current N1.23 billion.
• Net Assets grew by a marginal 6.70% from N176.13 billion to N187.93 billion.
• Retained Earnings reported for the period improved to N32.56 billion, same as 81.38% growth from the previously reported N17.95 billion.
• Total Deposits for the first three months of the year is currently estimated at N859.84 billion, which represents 12.81% appreciation over the N762.18 billion deposits of 2018 first quarter business session.
• Total Loans and Advances marginally runs over the comparable quarter by 3.25% at the current estimate of N615.18 billion as against N595.82 billion.
Financial Strength/Solvency Ratios
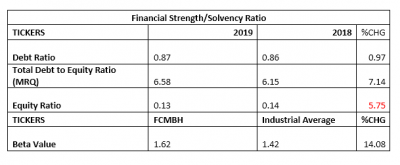
• Debt Ratio which compared Total Assets to Total Liabilities stood at 0.87x, implying that the Total Liabilities is 87% of Total Assets. Please understand that Total Liabilities is inclusive of Total Deposits for the period.
• Total Debt to Equity for the quarter stood at 6.58x, same as 7.14% above the 6.15x estimated in 2018. This implies that the company used 6.58 times of its equity through the period (note debt used is total liabilities and is inclusive of total deposits for the period).
• Equity Ratio which compared Equity to Total Assets stood at 0.13x, as against 0.14x implying that the reported Equity value at the end of the period is 13% of FCMBH’s Total Assets. Although, this is a 5.75% reduction from the previous estimate.
• Estimated Beta value for FCMBH as at the time this report was compiled stood at 1.62 which is above market beta. Although, it is above the industry average at the time this report was compiled.
Profitability Ratios
• EBITDA margin estimated for the period stood at 10.97%, 12.84% below the 12.58% estimated from the corresponding quarters’ numbers
• Pre-Tax Margin grew by 26.73% to 9.79% against the 7.72% estimated at the end of 2018 first quarter
• Interest Expenses to Gross Earnings inched up by 1.79% to 35.96%, against the previously estimated 35.33%.
• Return on Average Equity through the first three months of 2019 was 1.93% compared to the previous 1.47%
• See the table below for detailed profitability ratios and comparison.

Efficiency Ratios
• Operating Expenses through the period stood above the corresponding period of 2018 by 7.93% having moved from 38.73% to 41.81%.
• Gross Earnings is same as 3.08% of the Total Assets valuation at the end of the quarter, this is 8.04% below the 3.35% estimated in 2018.
• It was equally established that 71.55% of the total deposits for the period was given out as a loan. This is 8.48% below the 78.17% of deposit extended as loan and advances through 2018 first quarter.

Investment/Valuation Ratios
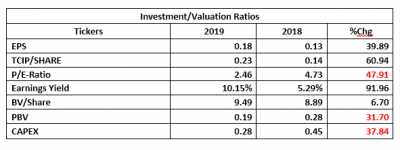
• At the end of the period, N0.18 was earned on each unit of FCMBH listed on the floor of the exchange. This higher than the N0.13 earned per share in 2018 first quarter.
• In the same trend, Total Comprehensive Income per share is currently estimated at N0.23 which is 60.94% above the N0.14 earned in 2018.
• The price of FCMBH at the time the result was released can replicate the earnings per share 2.46x times (P/E-Ratio=2.46x), which is lower than the 4.73x estimated in 2018.
• The said earnings per share is a 10.15% yield of the price of FCMBH on the floor of the exchange when the result was released to the investing public, this is a better yield when compared to 5.29% yield of 2018 first quarter.
• Estimated Book Value per share of FCMBH is currently N9.49, same as 6.70% above the N8.89 of 2018.
• Thus, Price to Book Value stood at 0.19x as against 0.28x, a situation that simply implies that the stock is currently selling below its Book Value on the exchange.
Valuation
While trying to place a fair value on each unit of FCMB Holdings, we considered the average of two valuation models. FCFE Stable Growth Model valued the stock at N2.15 per share, but the H-Model placed the price at N1.93. We, therefore, arrived at an average value of N2.04 for each unit of its listed shares.
