Company: FCMB Holdings Plc
Rating: Hold
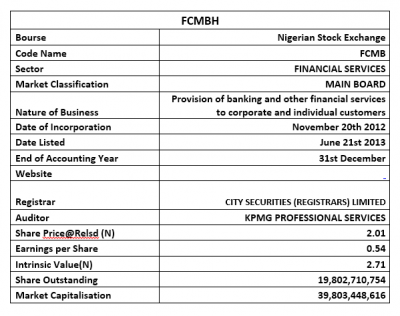
Current Market Price: N2.01
Loan-Deposit Ratio: 66.88%
Year High: N2.65
Year Low: N1.41
Fair Value: N2.71
Equity Analyst: Tunde Segun Jeariogbe
Key Investment Ratios
• This report observed the financial performance indices of FCMB Holdings for the period ended September 30, 2019; compared the same with that of a similar period in 2018 to establish growth. We have also valued the stock using the last full-year financials, along with few other trailing numbers.
• Loan to Deposit ratio was estimated at 66.88%, as against 76.71% in the corresponding quarter of 2018.
• A summary review of the released numbers shows a marginal growth in the top line and lower performance in the bottom line.
• We have fairly valued each unit of FCMB Holdings shares at N2.71 and rated it a Hold, which is 34.82% above the market valuation as at the time this report was released, and 247.23% below the estimated Book Value per share at the end of the quarter.
Company figures
• Gross Earnings reported for the period stood at N135.83 billion, up by a marginal 2.22% from the N132.87 billion posted in a similar period of 2018.
• Interest Income builds up by 6.69% to N101.80 billion, as against the N95.41 billion in 2018 third quarter.
• Similarly, Interest Expense stood over the comparable period by 8.03% at N45.57 billion from the previously reported N42.18 billion.
• Operating Expenses appreciated by 10.72% to N58.39 billion, compared to the N52.73 billion posted in the same period of 2018.
• Profit before Tax dropped to N12.80 billion, which is 13.30% below the N14.76 billion estimated in the corresponding period of 2018.
• In the same trend, Profit for the period stood at N10.79 billion, the same as 4.85% below the N11.34 billion profit achieved in a similar period of 2018.
• After considering other comprehensive incomes, the Total Comprehensive Income for the period is estimated at N7.30 billion, down from the N18.51 billion reported at the end of 2018 third-quarter.
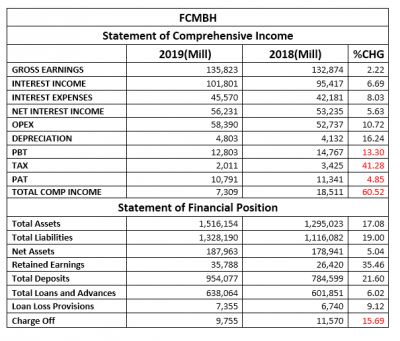
• Total Assets improved over the comparable period by 17.08% to N1.51 trillion, from N1.29 trillion of 2018 Q3.
• Total Liabilities equally improved by 19.00% after climbing from the previous N1.11 trillion to the current N1.32 trillion.
• Net Assets grew by 5.04% from N178.94 billion to N187.96 billion.
• Retained Earnings reported for the period improved to N35.78 billion, same as 35.46% growth from the previously reported N26.42 billion.
• Total Deposits for the first nine months of the year were estimated at N954.07 billion, which is a 21.60% appreciation over the N784.59 billion of the 2018 third-quarter business session.
• Total Loans and Advances marginally inched over the comparable quarter by 6.02% at the current estimate of N638.06 billion as against N601.85 billion.
• Loan Loss Provisions stood at N7.35 billion, up from the previously reported N11.57 billion at the end of the first nine months of 2018.
Financial Strength/Solvency Ratios
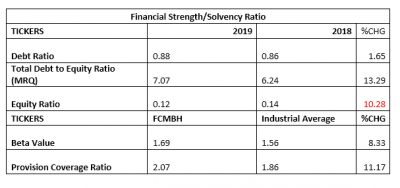
• Debt Ratio which compared Total Assets to Total Liabilities stood at 0.88x or 88%, implying that the Total Liabilities is 88% of Total Assets. Note that Total Liabilities is inclusive of Total Deposits for the period.
• Total Debt to Equity for the quarter stood at 7.07x, the same as 13.29% above the 6.24x estimated in 2018. This implies that the company used 7 times its equity through the period (Note: debt used to estimate the ratio is Total Liabilities and is inclusive of Total Deposits for the period).
• Equity Ratio which compares Equity to Total Assets stood at 0.12x, as against the previous 0.14x, implying that the reported Equity value at the end of the period is 12% of FCMBH’s Total Assets. However, this is a 10.28% reduction from the previous estimate.
• Estimated Beta value for FCMBH as at the time this report was compiled stood at 1.69 this stood above-market beta and industrial average.
Profitability Ratios
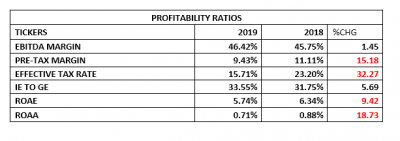
• Pre-Tax Margin dropped by 15.18% to 9.82%, as against the 11.11% estimated at the end of the 2018 nine-month performance.
• Interest Expenses to Gross Earnings inched up by 5.69% to 33.55% from the previously estimated 31.75%.
• Return on Average Equity, at the end of the quarter, was estimated at 5.74% compared to the previous 6.34%.
• See the table below for detailed profitability ratios and comparison.
Efficiency Ratios
• Operating Expenses to Gross Earnings Ratio stood slightly above that of the corresponding period of 2018 by a marginal 8.32% having moved from 39.69% to 42.99%.
• Gross Earning is the same as 8.96% of the Total Assets value at the end of the quarter. This is 12.69% below the 10.26% estimated in 2018.
• It was equally established that 66.88% of the total deposits for the period were given out as loans and advances to customers, which is 12.82% below the 76.71% of deposit given out as loans and advances through 2018 nine months business session.

Investment/Valuation Ratios
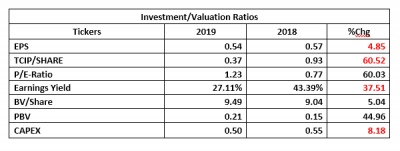
• At the end of the period, N0.54 was earned on each unit of FCMBH shares listed on the floor of the exchange, lower than the N0.57 reported in the 2018 third-quarter.
• Following the same trend, Total Comprehensive Income per share is currently estimated at N0.37 which is 60.52% below the N0.93 earned in 2018.
• The price of FCMBH at the time this report was released can replicate the earnings per share 1.23 times (P/E-Ratio=1.23x), higher than the 0.77x estimated in 2018.
• The said earnings per share is a 27.11% yield of the price of FCMBH shares on the floor of the exchange when the result was released to the market, this is a lower yield when compared to 43.39% yield of 2018 third quarter.
• Estimated Book Value per shares of FCMBH is currently N9.49, the same as 5.04% above the N9.04 of 2018.
• Thus, Price to Book Value stood at 0.21x as against 0.15x, which simply implies that the stock is currently selling below its book value on the floor of the exchange.
Valuation
While trying to place a fair value on each unit of FCMB Holdings shares, we considered the average of two valuation models. FCFE Stable Growth Model valued the stock at N3.43 while H-Model placed the price at N2.00. We, therefore, arrived at an average value of N2.71 for each unit of its shares. Thus, considering the mild gap between the current market price of FCMBH shares and our fair value, we have rated the Holding Company a Hold.


