Post Views:
452
Rating: Hold
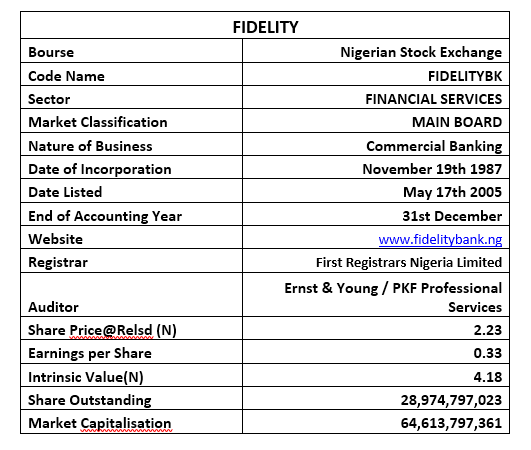
Current Market Price: N2.29
Year High: N2.79
Year Low: N2.08
Fair Value: N4.18
Equity Analyst: Tunde Segun Jeariogbe
Introduction
- This report observes the performance statistics of Fidelity Bank Plc for the first quarter of 2021, compared same with that of the similar quarter of 2020, and established a growth pattern accordingly.
- We also observed few valuation metrics and achieved conservative projections using the full-year performance indices for the year ended 31st December 2020 with growth estimated through the use of few other performance indices.
- Generally, the result can be rated impressive when put side-by-side figures released in the similar quarter of 2020.
- We have estimated Non-performing loan at 2.89%, down from last year’s 4.20%.
- See below for other financial indices.

Company figures
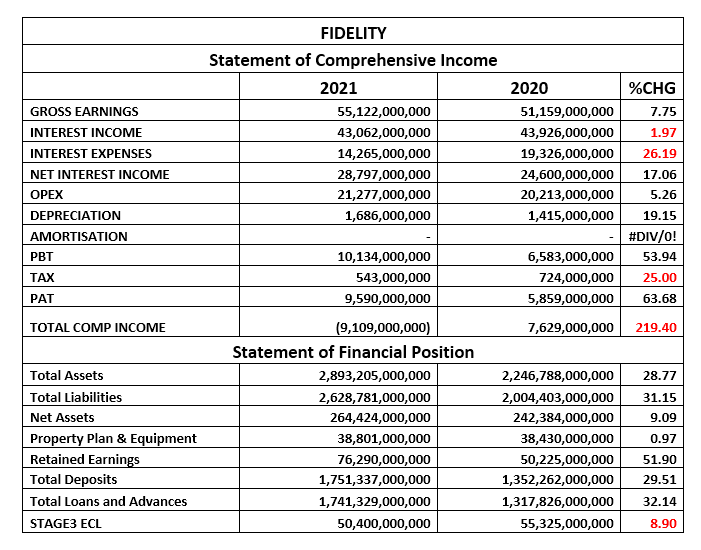
- Gross Earnings reported for the period stood at N55.12 billion, up from the N51.15 billion posted at the end of the 2020Q1.
- Interest Income stood at N43.06 billion, as against N43.92 billion in 2020 first quarter.
- Interest Expenses was estimated at N14.26 billion, the same as 26.19% below the reported N19.32 billion in 2020.
- Net Interest Income stood at N28.79 billion from N24.60 billion achieved at the end of 2020 first quarter.
- Operating Expenses grew by 5.26% above the comparable period, as it is currently valued at N21.27 billion against N20.21 billion.
- Profit before Tax stood at N10.13 billion, same as 53.94% above the N6.58 billion posted in the corresponding period.
- Having considered the Tax Expense for the period, a total of N9.59 billion was reported as Profit for the period, which is 63.68% above the N5.85 billion earned at the end of the first three months in 2020.
- Note that the Total Comprehensive Income for the period is negative, to the tune of N9.10 billion, as against N7.26 billion in the comparable period.

- Total Assets is currently valued at N2.893 trillion, same as 28.77% above the corresponding period valuation of N2.246 trillion.
- Similarly, due to improved deposit, Total Liabilities for the period was N2.628 trillion, from N2.004 trillion in 2020 first quarter business session.
- Net Assets is estimated at N264.42 billion, which is 9.09% above the N242.38 billion estimated last year.
- Retained Earnings remained positive at N76.29 billion, as against N50.22 billion last year.
- Total Deposit at the end of the period is same as N1.75 trillion, higher than the N1.35 trillion deposit reported in the corresponding quarter of 2020.
- Total Loans and Advances stood at N1.74 trillion, as against N1.31 trillion in 2020.
Financial Strength/Solvency Ratios
- Debt Ratio which compares Total Assets to Total Liabilities stood at 90.86%, implying that Total Liabilities is 90.86% of Total Assets. Note that Total Liabilities includes Total Deposits for the period.
- Total Debt to Equity for the quarter stood at 10.8x, same as 108.5% above the 8.27x estimated in 2020, implying that the company used Debt equivalent to 10.85 replicate of its equity through the period.
- Equity Ratio which compares Equity to Total Assets stood at 8.38%, as against 10.79% in the corresponding quarter; implying that the reported Equity at the end of the period is 8.38% of Total Assets.
- The estimated Beta value for Fidelity Bank as at the time this report was compiled stood at 1.15, higher than the industry average of 1.11.

Profitability Ratios
- Pre-Tax Margin grew by 42.87% to 18.38%, up from the 12.87% estimated at the end of first three months of 2020.
- Interest Expenses to Gross Earnings declined by 31.49% to 25.88%, as against the previously estimated 37.78% in the corresponding period.
- Return on Average Equity through the first three months of 2021 was 3.96% against 2.42% estimated from 2020 three months numbers.
- See below for detailed profitability ratios and comparisons

Efficiency Ratios
- Operating Expenses at the end of the period is 38.60% of the estimated Gross Earnings, slightly below the 39.51% achieved in 2020 three months financials. Please note that this implies marginal adjustment in expenses rate.
- Gross Earnings estimated from the financials is same as 1.91% of the Total Assets value posted for the period under analysis.
- Total Loan and Advances during the quarter is 99.43% of Total Deposit, representing a 2.03% upward adjustment over the 97.45% estimate in 2020. We note also that this is far above the 65% regulatory threshold for Nigerian banks.

Investment/Valuation Ratios
- Profit earned per unit of Fidelity Bank is estimated at N0.33, a 63.68% improvement over the N0.20 earned in similar quarter of 2020, and an indication that the Mustafa Chike-Obi-led board could offer a juicier dividend at the end of current year, if the management is able to sustain this momentum.
- Adjusted P/E-Ratio for the three-month dropped to 1.68x from 2.25x, translating into less waiting period by investors.
- The said earnings per share yielded 14.84% of the price of each units of Fidelity Bank’s shares on the exchange on the day the result was released to investors through the exchange.
- Estimated value of each unit of Fidelity Bank is N8.37, same as previous quarter’s estimate.
- Confirming the academic under-priced position of Fidelity Bank’s shares on the exchange is the Price to Book Value estimate that stood far below unity.

Valuation
Exploring our blend of valuation tools, we conservatively valued each unit of Fidelity Bank shares at N4.18, thus, we rated it a Hold.


