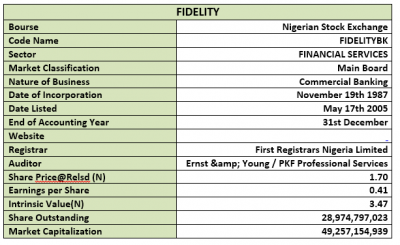
Coy: Fidelity Bank Plc
Rating: Buy
Current Market Price: N1.70
Year High: N4.33
Year Low: N1.70
Fair Value: N3.47
By: Jeariogbe Tunde Segun (Equity Analyst)
Key Financials
• This analysis is based on the 2018 half year financial statistics of Fidelity Bank Plc, which is compared with figures for the similar period in 2017.
• The result arrived on August 29, a month later than that of 2017, owing to the decision by the board to audit the financials, the first time in its history. However, from records, the management of Fidelity has never released its half-year result earlier than July 24, since 2014.
• Total Comprehensive Income (TCI) for the period stood at 22.55%, below that of the previous half year.
• In other words, TCI for the just reported period was N8.514bn as against the previous N10.993 billion
• Thus, as against the estimated N0.41 EPS, Total Comprehensive Income Per Share (TCI/Share) is N0.29.
• The reduced TCI was due to Net losses on debt instruments at fair value amounting to N3.432 billion.
Company Figures
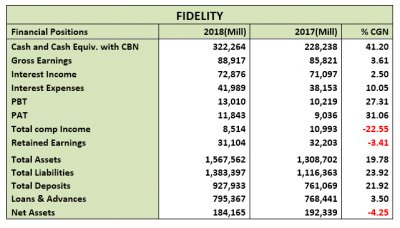
• Gross Earnings improved by a marginal 3.61% over the 2017H1, while Gross Earnings was N88.917 billion, as against N85.821 billion.
• Similarly, Interest Income inched up by 2.50% over the similar period of 2017
• Meanwhile, Interest Expenses for the period was N41.989 billion, 10.05% above what was reported in the 2017 half year.
• Fee and Commission Income stood at N13.703 billion, up from N9.411 billion in 2017
• Fee and Commission Expenses however maintained a close gap at the current N1.759 billion, compared to N1.988 billion.
• Profit before Tax (PBT) therefore stood 27.31% above last year’s numbers. Current PBT was N13.010 billion as against N10.219 billion
• Having considered same tax rate as in the previous half year, N11.843 billion was announced as the Profit for the period compared to the previous N9.036 billion.
• As noted above, Total Comprehensive Income fell to N8.514 billion, from N10.993 billion.
• Retained Earnings slipped marginally to N31.104 billion, from N32.203 billion.
• Total Assets grew by 19.78% to N1.567 trillion from N1.308 trillion while Total Liabilities stood at N1.383 trillion against N1.116 trillion.
• Customer Deposits for the period was estimated at N927.36 billion, compared to the N761.06 billion achieved at the end of 2017 half year.
• Meanwhile, Loans and Advances is currently N795.36 billion, 3.50% above that of 2017
• Net Assets for the period was N184.16 billion, 4.15% below the N192.33 billion announced last year.
Volatility Ratios
• Estimated beta value of Fidelity Bank is well above both the market and average industry beta value, which confirms volatility/patronage of its shares on the Exchange
• Although almost irrelevant, since we analyze a financial institution whose major business is to collect deposit (mostly reported under liability), we have estimated Debt to Equity ratio at 112.75%, well above the industry average of 25.31%.

Profitability Ratios
• Interest Expense to Gross Earnings is presently estimated at 47.22%, 6.22% above the 44.46% estimated in the corresponding period of 2017.
• PBT margin stood at 14.63% as against 11.91% last year, this is a 22.88% improvement.
• Similarly, Profit Margin looks up against last year. We have estimated 13.32% margin from Gross Earnings as against the previous estimate of 10.53%
• Return on Average Equity is now 6.43% compared to the 4.70% returns achieved in the first six months of 2017
• Return on Average Assets differed by 9.42%, moving from 0.69% to 0.76%

Efficiency Ratio
• Gross Earnings to Total Assets is estimated at 5.67%, which is 13.50% lower than the 6.56% estimated in 2017.
• Similarly, Gross Earnings to Equity is now 48.28% as against the 44.62% estimated from 2017 half year financial statistics
• Financial leverage is 8.51x, as against the previous 6.80x, this is an estimate of the number of times the total assets replicates the equity, in other words the ratio got better.
• It was also established that 85.71% of the Total Deposit was given out as Loan and Advances during the period under review, which is 15.11% lower than the 100.97% given out during the first six months of 2017
• Meanwhile, Loan and Advances is 50.74% of the Total Assets, 13.59% lower than the 58.72% of previous half year, showing a controlled/reduced risk, compared to 2017

Investment Ratios
• Just as in the company report above, since shares outstanding remained constant during the two periods under consideration, the estimated amount earned per units of Fidelity Bank is N0.41, which is 31.06% better than the N0.31 earned last year
• Due to Net losses on debt instruments at fair value experienced during the reported period, the Total Comprehensive Income per share for the period was N0.29 as against N0.38 last half year, this is 22.55% drop
• PE/Ratio for the period is 2.30x as against 2.50x estimated last year.
• As we speak the Book Value of Fidelity Bank is N6.36, fairly same as N6.64 last year. This confirms that the company is currently undervalued.
• Also confirming this fact is the Price to Book Value that is estimated at below unity, proving the low price, when compared to the value sitting in its books.
• Operating Expenses for the period is currently 47.22%, this is 6.22% below the 44.46% of 2017 half year’s financials.

Valuation
Our attempt to place a fair value on Fidelity Bank took us through several valuation methods after which we settled for the constant perpetual dividend growth rate. We limited our income consideration to the Total Comprehensive Income, since that is the true financial state of the bank, while not forgetting the importance of Profit after Tax. We also considered the last dividend of 11k by the bank in its financial statement for the year ended December 31, 2017 along other valuations indices. Thus we arrived at a Fair Value of N3.47. This value is twice the current market price and 83.28% below the estimated Book Value of Fidelity Bank. We have Rated Fidelity share price as Buy.


