Company: Wema Bank Plc
Rating: Buy
Current Market Price: N0.77
NPL RATIO:
Year High: N1.05
Year Low: N0.55
Fair Value: N2.07
By: Jeariogbe Tunde Segun (Equity Analyst)
Key Financial Ratios
•This report observed the full year financial performance indices of Wema Bank Plc for the year ended, 31st December, 2018; compared same with the full year financial statistics released in 2017 to establish growth and project future expectations.
•Having maintained positive retained earnings stance through and through, the financial institution finally rewards its investors with a kobo cash dividend after a long wait of no incentives.
•The proposed dividend is same as 3.90% yield of the price of each units of Wema Bank’s share on the floor of Nigerian Stock Exchange as at the time the result was made available to the investing public.
•Meanwhile, the nine kobo per share earned in the 2018 financial activities is a yield of 11.20% of the price of each unit of the bank’s share on the floor of Nigerian Stock Exchange as at the time the result released.
Dividend Information
Dividend: Three kobo
Closure Date: 29th April, 2019
Payment Date: 13th May, 2019

Company Figures
• Gross Earnings improved over the comparable year by 9.59% at N71.529 billion, as against the N65.268 billion reported for the corresponding year-2017.
• Similarly, Interest Income grew by 8.60% to N57.634 billion, compared to N53.073 billion posted in the 2017 financial year.
• Interest Expenses, on the other hand, reduced marginally by 8% to stand at N33.306 billion from N30.642 billion.
• Profit before Tax (PBT) rose by a faster 59.43% to N4.797 billion, from N3.009 billion in the similar period in 2017.
• Thus, Profit for the period (PAT) followed similar trend, standing at N3.326 billion, 47.48% above the N2.255 billion reported in prior year.
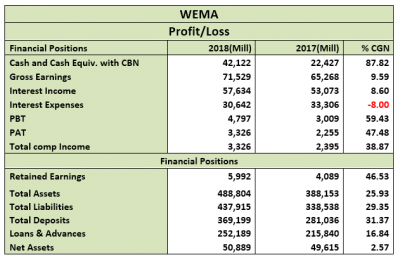
• Retained Earnings therefore was built through the years to N5.992 billion, 46.53% higher than the N4.089 billion for the year ended 31st December, 2017.
• Total Assets appreciated to N488.804 billion, growing by 25.93% above the N388.153 billion in the previous financial year.
• This was chiefly boosted by growth in deposits, Total Liabilities stood above that of comparable year by 29.35%; as it is currently estimated at N437.915 billion against N338.538 billion.
• As noted above, Total Deposit improved by 31.37% to N369.199 billion against N281.036 billion.
• Loans & Advances equally improved by 16.84% to N252.189 billion, compared to N215.840 billion in 2017.
• Meanwhile, due to the fair difference between Total Assets and Total Debt, shareholders’ funds only inched up by 2.57%. Please note that N50.889 billion is the current value of this financial index as against N49.615 billion.
Volatility Ratios
• Going by the estimated Beta value of Wema Bank Plc, its share price is currently enjoying heightened patronage, currently running a Beta value that is higher than unity and above industry average.
• Please understand that Debt-to-Equity Ratio is estimated, using the entire liability value (which of cause includes the deposit). Thus we have estimated that total liability is same as 8.61 times of the Equity value. This is fairly above the estimated industrial average.
• Please note that when we deducted Deposit value from the Total Liabilities, we arrived at Debt-to-Equity Ratio of 135.03% as against Industrial Average of 187.38%.

Profitability Ratios
• Interest Expense to Gross Earnings dropped by 16.05% from the previously estimated 51.03% to 42.84%.
• Profit before Tax Margin (PBT Margin) increased over the previous estimate by 45.48%, moving from 4.61% to 6.71%.
• Profit Margin equally grew over the last full year’s estimate by 34.57%, as it is now estimated at 4.65%, as against the previous 3.46%.
• Return on Average Equity (ROAE) stood at 43.79% above 2017 estimate. We have currently estimated 6.54% as against 4.55%
• Return on Average Assets equally appreciated by 17.11% to currently stand at an estimate of 0.68%, as against 0.58% in 2017 financial indices.

Efficiency Ratio
• Gross Earnings to Total Assets is estimated at 14.63% this is 12.97% below the estimate in 2017.
• Meanwhile, Gross Earnings to Equity is now 140.56% as against the 131.55% estimated from 2017 full year financial statistics.
• It was also established that 68.31% of the Total Deposit was advanced as Loan during the year under estimate; this is 11.06% lower than the 76.80% in prior year.
• Meanwhile, Loan and Advances is same as 51.59% of Total Assets, which is 7.22% lower than the 55.61% estimated in 2017.

Investment Ratios
• The estimated amount earned per units of Wema Bank shares is N0.09, or 47.48% above the N0.06 earned in 2017 financial year.
• The said earnings per share yielded 11.20% of the current market price on the day the result was made available to the investing public, which is a better yield than the 7.59% achieved in previous financial year.
• PE Ratio for the period is 8.93x as against 13.17x estimated last year.
• As we speak, the Book Value of Wema Bank is N1.32 fairly same as N1.29 last year. Should we choose to value this equity with this indices, we shall conclude an underpriced position of each units of its shares on the floor of the exchange
• Further confirming the underpriced state of Wema Bank Shares is the Price to Book Value ratio that stood below unity.
• OpEx Margin grew by 11.03% having moved to 41.02% from 45.55%.
• The N0.03 proposed as dividend for the year is same as 34.79% of the amount earned per unit shares of Wema Bank Plc through the 2018 financial activities. In other words, Retention Ratio is same as 65.21%. In our opinion this is good for a growth stock
• We have also estimated dividend sustainability rate at 4.26%.

Valuation
Through our blend of valuation models, fully considering the non dividend payment of the financial institution before this year’s, we have valued each units of Wema Bank Plc at N2.07. Thus, considering the current market price of N0.77 (as at the time this report was concluded), we rate Wema Bank shares a Buy.


