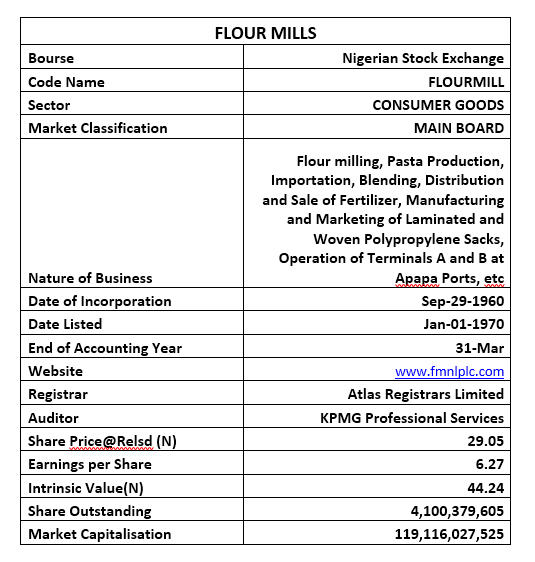
Rating: Buy
Current Market Price: N29.69
Latest Dividend: N1.65
Full Year EPS: N1.65
Year High: N35.00
Year Low: N26.00
Fair Value: N44.24
Equity Analyst: Tunde Segun Jeariogbe
Key Investment Ratios
- This report observes the full-year financials of Flour Mills Nigeria Plc for the year ended 31st March 2021 and compares the same with those released for the corresponding period of 2020. In this way, we able to establish its growth trajectory.
- This result, along with few other accounts for past years were considered to arrive at our projections and valuation for the company as stated in this report.
- The full-year result is an outstanding performance, given the over 100% growth in the bottom- line when put side-by-side that of the corresponding full-year result.
- See the table below for detailed analysis and comparison of ratios with the immediate last full-year numbers

Dividend Information
- With the end of the 2021 full-year, Flour Mills excited its investors by announcing a N1.65 cash dividend, which is a 17.68% improvement over the N1.40 paid in the corresponding period of last year.
- Estimate shows that the said cash dividend is same as 26.31% of the total earnings for the year. Note that this payout ratio is below the 50.46% done in 2020.
- Furthermore, the said dividend is a yield of 5.68% over the share price of Flour Mills on the Nigerian Exchange on the day it was unveiled to the investing public, just as it is noteworthy that the low yield is due to the large difference in share price within the two compared years.
- Thus, Sustainable Growth Rate estimated stood at 10.85%, far above the 3.62% estimated at the end of 2020 full-year announcement.

Company figures
- The reported full-year Turnover value at N771.60 billion represented a 34.48% improved upon that of the corresponding year’s N573.77 billion.
- Cost of Sales grew similarly by 30.88% to N664.85 billion, compared to the N507.98 billion posted in its 2020 full-year.
- Operating Profit stood at N52.19 billion, after improving from N35.07 billion posted in 2020.
- Similarly, Operating expenses increased by 26.06% over the comparable period as the figure stood at N41.12 billion, up from N32.64 billion in the corresponding year.
- Finance cost grew marginally slower in the period under review, reducing by 6.61% to N18.65 billion, compared to N19.95 billion in the corresponding year.
- After considering all expenses and incomes, Profit before Tax for the year leaped to N37.28 billion from N17.49 billion in its 2020 financials.
- Thus, having consider Taxation expenses for the period, the management of Flour Mills posted a full-year Profit of N25.71 billion as against N11.37 billion in the corresponding year.

- Current Assets amounted to N306.000 billion, 61.28% better than the N189.73 billion estimated at the end of the 2020 year.
- Non-Current Assets held by Flour Mills is currently valued at N238.72 billion as against N242.72 billion posted at the end of 2020 business session
- Current-Liabilities stood at N209.69 billion same as 40.96% above the N148.75 billion stated in its 2020 full year result
- Non-Current Liabilities grew by 25.44% to stand at N160.42 billion as against N127.88 billion in 2020
- Net Assets posted for the year therefore, is valued forN174.61 billion above the N155.80billion in 2020.
- Retained Earnings on the other hand improved by 26.91% to stand at N90.90 billion versus N71.62 billion in 2020.
Financial Strength/Solvency Ratios
- Debt Ratio is currently estimated at 67.95%, same as 6.21% above the 63.97% estimated in 2020. This implies that, Total Liabilities is same as 67.95% of Total Assets.
- Total Debt to Equity was equally estimated at 211.96%, as against 177.56% estimated in the comparable period. This implies that more debt were used in servicing the company’s assets through the period.
- It was also established that Equity is same as 32.05% of Flour Mills’ Assets Value, estimate from 2020 full year numbers yielded 36.03%.
- Nevertheless, we can conclude that the company’s shares are fairly liquid and averagely patronised, although the estimated Beta stood slightly below our estimated industry average, and below market beta.

Profitability Ratios
- EBITDA margin estimated for the period stood at 10.65%, above the 6.11% estimated from the 2020 full-year earnings.
- Pre-Tax Margin equally grew by 58.46% to 4.83%, as against the 3.05% estimated at the end of the 2020 full year.
- Cost of Sales was 86.16% of the Turnover figure, 2.68% below the 88.53% estimated in 2020. This confirms management’s effort at controlling the direct cost of running the business.
- Return on Equity stood at 14.73%, as against 7.30% last year.

Efficiency Ratios
- Operating Expenses to Turnover value is same as 5.33%, this is 6.26% improvement in efficiency during the quarter
- Turnover to Total Assets Ratios stood at 141.65% against 132.68%, is 6.76% improvement in management efficiency when compared to estimates from the 2020 full-year performance. It is important to note that this is a rare performance
- See below for details

Investment/Valuation Ratios
- When compared with 2020 full earnings numbers, the amount earned per unit improved outstandingly to N6.27 from the previous estimate of N2.77.
- P/E-Ratio dropped by 31.46% to 4.63x from 6.76x.
- The said Earnings per Share yielded 21.59% of the current market price of Flour Mills shares on the exchange as of when the result was made available to the investors.
- The Book Value of Flour Mill is currently estimated at N42.58 per share, far above the market value on the exchange, and below our Intrinsic Value for Flour Mills.
- Confirming the under-priced status of Flour Mills shares on the exchange is the Price to Book Value at below unity (0.68x).
| Investment/Valuation Ratios | |||
| Tickers | 2021 | 2020 | %Chg |
| Price at Released | 29.05 | 18.75 | 54.93 |
| EPS | 6.27 | 2.77 | 126.05 |
| TCIP/SHARE | 5.97 | 2.77 | 115.14 |
| P/E-Ratio | 4.63 | 6.76 | -31.46 |
| Earnings Yield | 21.59% | 14.80% | 45.90 |
| BV/Share | 42.58 | 38.00 | 12.07 |
| PBV | 0.68 | 0.49 | 38.25 |
Valuation
Having considered the financial status of Flour Mills, against the aggressive product patronage and the accompanying price increase, while maintaining our conservative valuation approach, we have made these projections. We assumption that the management will work on reducing the interest yielding and further building both performance and dividend over the coming years, we therefore have valued each unit of Flour Mills at N44.24and have rated it a Buy.
Five (5) Years Full Year Earnings History
| FLOUR MILLS | ||||||||
| Company Numbers | ||||||||
| Year | 2021 (Mill) | 2020 | 2019 | 2018 | 2017 | |||
| Date Released | 29-Jun-21 | 03-Aug-20 | 15-Jul-19 | 03-Jul-18 | 03-Jul-17 | |||
| Turnover | 771,607 | 573,774 | 527,404 | 542,670 | 524,464 | |||
| Cost of Sales | 664,850 | 507,987 | 474,057 | 473,895 | 457,775 | |||
| Operating Profit | 52,196 | 35,079 | 32,296 | 48,422 | 41,439 | |||
| Opex | 41,125 | 32,624 | 27,589 | 25,603 | 23,760 | |||
| Profit before Tax | 37,284 | 17,496 | 10,174 | 16,541 | 10,472 | |||
| Tax Expenses | 11,567 | 6,120 | 5,948 | 2,781 | 1,636 | |||
| Profit After Tax | 25,716 | 11,376 | 4,000 | 13,615 | 8,836 | |||
| Total Comprehensive Income | 24,476 | 11,376 | 4,293 | 13,048 | 9,598 | |||
| Current Assets | 306,005 | 189,731 | 180,269 | 174,245 | 254,883 | |||
| Non-Current Assets | 238,727 | 242,722 | 236,552 | 234,102 | 222,719 | |||
| Total Assets | 544,732 | 432,453 | 416,821 | 408,347 | 477,603 | |||
| Current Liabilities | 209,696 | 148,758 | 184,628 | 199,788 | 307,496 | |||
| Non-Current Liabilities | 160,422 | 127,887 | 81,220 | 57,943 | 72,562 | |||
| Total Liabilities | 370,118 | 276,646 | 265,849 | 257,731 | 380,058 | |||
| Retained Earnings | 90,905 | 71,629 | 66,377,553 | 67,903 | 60,450,685 | |||
| Net Assets | 174,613 | 155,807 | 150,972 | 150,616 | 102,544 | |||
| Dividend Paid | 1.65 | 1.4 | 1.2 | 1 | 1 | |||
| ESTIMATED RATIOS | ||||||||
| EPS | 6.27 | 2.77 | 0.98 | 3.32 | 3.37 | |||
| TCI/SHARE | 5.97 | 2.77 | 1.05 | 3.18 | 3.66 | |||
| PE/RATIO | 4.63 | 6.76 | 16.61 | 9.86 | 8.02 | |||
| EARNINGS YIELD | 21.59% | 14.80% | 6.02% | 10.14% | 12.47% | |||
| BOOK VALUE | 42.58 | 38 | 36.82 | 36.73 | 39.08 | |||
| PROFIT MARGIN | 3.33% | 1.98% | 0.76% | 2.51% | 1.68% | |||
| RETURN ON EQUITY | 14.73% | 7.30% | 2.65% | 9.04% | 8.62% | |||


