Rating: Hold
Current Market Price: N7.15
Latest Dividend: N0.55
Year High: N7.20
Year Low: N3.45
Fair Value: N8.42
Equity Analyst: Tunde Segun Jeariogbe
Key Investment Ratios
- In this report we observed the full-year financials released by Glaxo Smithkline Consumers for the year ended, 31st December, 2019, compared same with those of the corresponding period of 2018, to establish growth, make projections and undertake valuation analysis.
- It was observed that the management of Glaxo Smithkline rounded up year 2019 with zero finance cost, in other words, it reported zero Non-Current Liabilities for the period under review, as against the N107.08 million reported in 2018.
- In other words, the company does not have interest yielding liabilities. By implication, the reported current liabilities only include items like: unpaid dividend, advance from customers, trade payables, pension payables etc.
- Meanwhile, the directors have proposed a N0.55 cash dividend for the just concluded year, compared to the N0.50 paid for at the end of the 2018 year.
- The qualification date for the said dividend is 22nd June, 2020, while payment date is 24th July, 2020.
Please see the table below for detailed analysis:
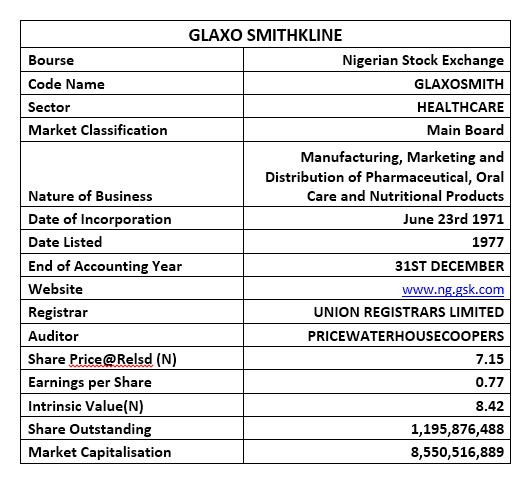
Company figures
- Turnover reported at the end of the year under review was N20.76 billion, 12.76% above the N18.41 billion reported in the corresponding period of 2018.
- Cost of Sales grew by 17.82% at N14.70 billion, compared to the N12.48 billion reported through the 2018 financial year.
- Profit before Tax at the end of the year was estimated at N1.169 billion, a marginal improvement over the N1.160 billion achieved in the previous year.
- Tax Expenses allowance for the year was N252.22 million, versus N542.53 million in the similar period of 2018.
- Thus, Net Profit for the period was estimated at N917.10 million, this was 48.49% above the N617.62 million in the corresponding period of 2018.
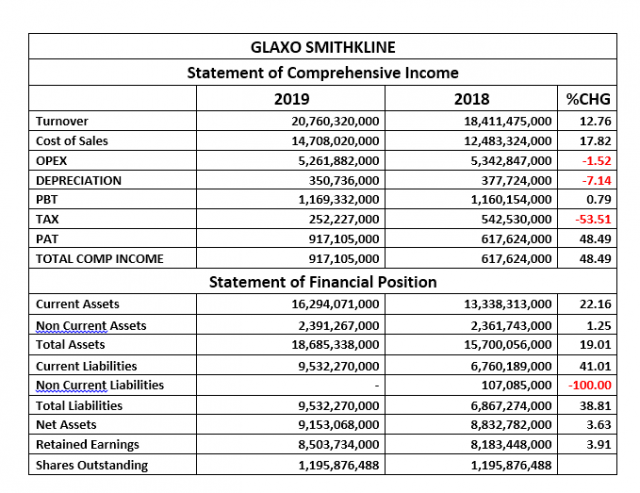
- Current Assets of Glaxo Smithkline at the end of the year was valued at N16.29 billion, same as 22.16% above the N13.33 billion in the corresponding year.
- Non-Current Assets was estimated at N2.39 billion, a marginal increase of 1.25% above the N2.36 billion in the comparable year.
- Current Liabilities grew by 41.01% to N9.53 billion, compared to N6.76 billion stated in its 2018 year-end report.
- As noted above, the company has no Non-Current Liabilities at the end of 2019; which is against the N107.08 million stated in the 2018 year-end.
- Net Assets is valued at N9.15 billion, versus N8.83 billion in the corresponding period of 2018.
- Retained Earnings inched up by 3.91% at N8.50 billion, compared to N8.18 billion in the preceding year.
Financial Strength/Solvency Ratios
- The amount reported as Total Liabilities is the same as 51.01% of the Total Assets Value at the end of the year, which is higher than the estimated 43.74% in the corresponding year. It is important to note that the liabilities here were mainly short-term.
- The short-term liabilities mentioned above, is the same as 104.14% of the company’s shareholders’ fund reported during the period; this is against the estimated 77.75% at the end of the 2018 financial year.
- Glaxo SmithKline shareholders’ funds at the end of the year was the same as 48.99% of the Total Assets Valuation, this was a lower ratio, when compared to 56.26% achieved at the end of the 2018 financial year.
- Nevertheless, going by the estimated beta value of 0.67x, it can be safely concluded that the shares of Glaxo Smithkline are less liquid, compared to its industry peers.

Profitability Ratios
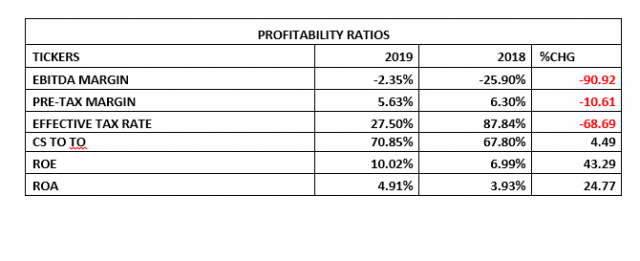
- EBITDA margin estimated for the quarter stood at -2.35%, an improvement over the the -25.90% estimated from 2018 full year earnings numbers.
- The amount reported as profit before Tax is same as 5.63% of the Turnover value, which is 10.61% drop from the 6.30% estimated in 2018.
- Cost of Sales is 70.85% of the Turnover figure, which is only 4.49% above the 67.80% estimated in 2018. This is a confirmation of the management’s effort to control its direct cost.
- Return on Equity stood at 10.02% as against 6.99% achieved in 2018.
- See below for details:
Efficiency Ratios
- Operating Expenses to Turnover ratio is same as 25.35%, which is a 12.66% improvement in management efficiency from the 29.02% estimated from 2018 full-year financial indices.
- Turnover to Total Assets Ratios stood at 111.10% as against 117.27%, a marginal drop in management efficiency within the two compared years.
- Working Capital Ratio, which indicates a company’s effectiveness in using its working capital was estimated at 3.07x, a 9.69% growth from the 2.80x estimated in 2018
- See below for details:

Investment/Valuation Ratios
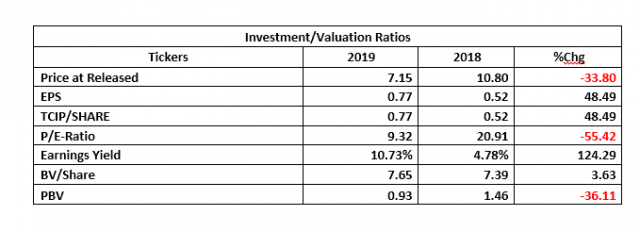
- At the end of 2019 financial year, the management of Glaxo Smithkline earned N0.77 on every unit of its shares, this is higher than the N0.52 earned in 2018.
- PE/Ratio becomes more attractive with the price adjustment and the earnings growth recorded. We have estimated PE/Ratio at 9.32x versus 20.91x in 2018
- The said earnings per share yielded 10.73% of the price of Glaxo Smithkline on the Nigerian Stock Exchange as of when the result was made available to the investing public.
- The shares of Glaxo Smithkline have been estimated at N7.65 in its books as at the end of 2019 financial year, this is a marginal improvement above the N7.39 estimated in 2018, and slightly above the price on the floor of the exchange.
- Confirming a marginal underpriced status is the Price to Book Value ratio at slightly below unity.
See below for detailed investment ratios:
Valuation
Impacted by dividend growth between the two years observed in this report, and low rate from the 91-days T-Bill Rate; we have conservatively valued each units of Glaxo Smithkline’s share price at N8.42and Rated it a Hold.


