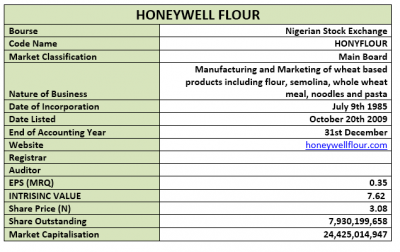
Company: HONEYWELL FLOUR MILLS PLC
Rating: Hold
Current Market Price: N2.31
Intrinsic Value: N7.62
Ex-Div: N0.06
By: Jeariogbe Tunde Segun (Equity Analyst)
Key Financial Tickers
• This report majorly considered Honeywell Flour Mills’ nine-month financials for the period ended December 31, 2018.
• Please note that YoY, the company recently exited the negative territory and has outstandingly built its income elements through the just concluded financial year
• The company’s Managing Director, Olanrewaju Jaiyeola during its last Annual General Meeting, announced plans to increase production capacity from 48,000 to 125,000 metric tones by the first quarter of 2018. This will be achieved through its new factory expected to be in place before the end of 2108Q1.
• Although it is not fully established if operation has already commenced in the said factory, we believe that it will positively impact investors take home.

Corporate Figures
• Within the two periods compared in this report, we observe an all round improvement in Honeywell Flour’s income statement.
• Sales grew by 43.9%, rising from N37.974 billion to N54.645 billion
• Operating Profit equally improved by 21.37% over the comparable quarter. Presently, estimated Operating Profit is N7.058 billion, compared to the previous N5.801 billion.
• Both Profit before and after tax soared over corresponding quarter of the previous year by 110.09% and 110.28% respectively
• Outstandingly, the company built its Retained Earnings portfolio at a very fast rate after exiting loss position. The figure moved from N7.258 billion to N44.214 billion.
• Non Current Assets improved by a marginal 8.86%, moving to N101.827 billion from N93.537 billion.
• Current Assets on the other hand climbed by 163.45% to N23.210 billion, when compared to N8.810 billion.
• Non Current Liabilities grew by 24.68% over the similar period of 2016
• Meanwhile, Current Liabilities dipped against the comparable year by 16.87%, to currently stand at N29.282 billion from N35.226 billion.

Liquidity/Risk Ratios
• Debt to Equity ratio estimated from the latest financials of the company is 152.80% higher than the industry average, compared to the acceptable threshold of 65.12%.
• Estimated Current Ratio from its nine months financials is less than 1, just as it is lower than the industry average. The simple interpretation of this ratio is that the company may not be able to immediately settle its current liabilities as at when due.
• Judging by the estimated 1.66 beta rate, it is safe to conclude that shares of Honeywell Flour Mills are highly patronized by investors on the floor of The Nigerian Stock Exchange.

Profitability Ratios
• Typical of the Oil & Gas industry, the Cost of Sale Margin is high at 76.87% of the Turnover value. Please observe that the rate is on a slight increase above comparable quarter’s estimate
• Due to the high Cost of Sales and other costs, the Profit before Tax Margin is currently estimated at 6.36%, which is 46% above the previous estimate of 4.36%.
• Similarly, Profit Margin is 5.09%, as against the previous estimate of 3.48%.
• Both Return on Average Equity and Assets are lower as shown in the table below.

Efficiency Ratios
• Total Assets Turnover improved by 17.79% as it is currently estimated at 43.70% from the previous 37.10%
• Equity Turnover dropped by 10.15% as against the previous quarter’s estimate. Current estimate is 100.01% from 111.31%
• Fixed Assets Turnover on the other hand was turned over in 0.54 times above the 0.41 times usage reported in previous nine months result

Investment Ratios
• The amount earned per unit of Honeywell share is currently estimated at N0.35, more than double the N0.17 estimated last nine months
• The said earnings is same as 11.39% of the share price of Honeywell as at the time this result was made available to the investing public.
• Though fondly patronized by the investing public, there has not been an outstanding revaluation of its share price. Hence, despite the improved earnings, Price/Earnings ratio remained almost static.
• Price to Book Value reflected an underpriced nature of Honeywell Flour Mills share price
• Re affirming this position is the large difference between the current market price of Honeywell Flour share price and the estimated Book Value of each unit of the shares in the company’s book.
• Appreciable is the estimated 5.09% Operating Expenses to the Turnover Value, although this is higher than the 3.48% estimate in the comparable period.

Valuation
• In placing an intrinsic price tag on the share price of Honeywell Flour Mills, we explored DDV- Two Stage H-Model. Using the last cash dividend of N0.06.
• Other parameters includes, Gs= 15%, Gl= 9%, H=3 and required return was set at 10%. Exploring the necessary avenue, we have placed Honeywell Flour’s share price at N7.62 each.


