Post Views:
542
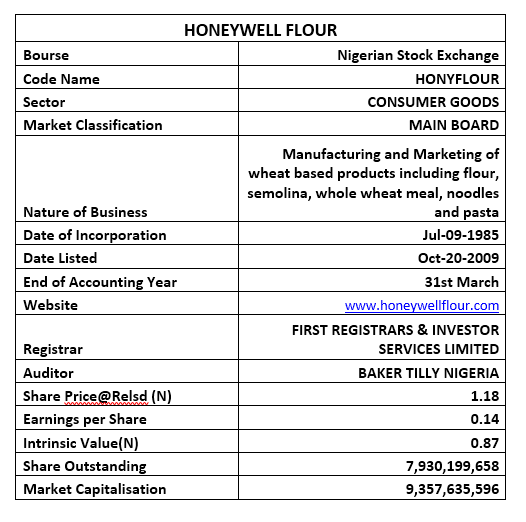
Rating: Hold
Current Market Price: N1.60
Latest Dividend: N0.07
Full Year EPS: N0.14
Year High: N1.73
Year Low: N1.08
Fair Value: N0.87
Equity Analyst: Tunde Segun Jeariogbe
Key Investment Ratios
- This report observes the full-year financials of Honeywell Flour Mills Plc for the year ended 31st March 2021, compares the same with those of the corresponding period in 2020.
- This result along with others was combined in making a projection and arriving at a valuation for the share price used in this report.
- The full-year numbers showed an outstanding growth of over 70% growth in profit when put side-by-side with those of the prior year.
- See below for a detailed analysis and comparison of ratios with those for a previous full year.

Dividend Information
- At the end of the 2021 full-year business session, the board of Honeywell Flour Mills excited investors, announcing a N0.07 cash dividend, representing a 75.00% improvement over the N0.04 paid in the corresponding year
- Estimates showed that the said dividend is 49.31% of the total earnings achieved through the year, marginally higher than the 48.76% earnings paid to investors in the corresponding year.
- In the same trend, the said dividend is a yield of 5.93% over the share price of Honeywell Flour Mills on the exchange as of the time this report was released to investors. It is important to note that the low yield was due to the large difference in share price within the two periods.
- Thus, the Sustainable Growth Rate estimate stood at 0.98%, far above the 0.58% estimated at the end of the 2020 full-year announcement.

Company figures
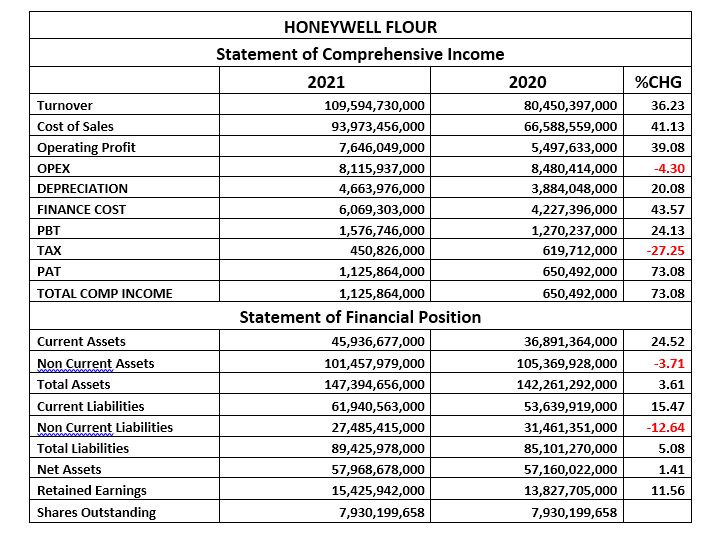
- Full-year Turnover value improved by 36.23% over the previous year’s at N109.59 billion, from N80.45 billion in the corresponding year.
- Cost of Sales grew in the same trend, improving by 41.13% to N93.97 billion, compared to the N66.58 billion posted in its 2020 full-year earnings report.
- Operating Profit achieved is estimated at N7.64 billion, this was also an improvement over the N5.49 billion posted in its 2020 result.
- Conversely, operating expenses dropped by a marginal 4.30% in the comparable period to N8.11 billion, as against N8.48 billion in the corresponding year.
- Finance cost soared by 43.57% to N6.06 billion compared to N4.22 billion in the previous year.
- Profit before Tax for the year stood at N1.57 billion, as against N1.27 billion stated in its 2020 financials.
- Thus, having considered Tax Expenses for the period, the management of Honeywell Flour Mills posted a full-year profit of N1.12 billion as against N650.49 million in the corresponding year

- Current Assets is currently valued at N45.93 billion, the same as 24.52% above the N36.89 billion estimated at the end of the 2020 business session.
- Non-Current Assets held by HoneywellFlour Mills is currently valued at N101.45 billion, compared to the N105.36 billion posted in 2020.
- Current-Liabilities stood at N61.94 billion same as 15.47% above the N53.69 billion stated in its 2020 full-year.
- Non-Current Liabilities dropped by 12.64% to N27.48 billion, as against N31.46 billion in 2020.
- Net Assets during the year, therefore, is valued forN57.96 billion slightly above the N57.16billion in 2020.
- Retained Earnings on the other hand improved by 11.56% at N15.42 billion versus N13.82 billion in 2020.
Financial Strength/Solvency Ratios
- The Debt Ratio is currently estimated at 60.67%, the same as 1.42% above the 59.82% estimated in 2020, which implies that Total Liabilities is the same as 60.67% of Total Assets.
- Total Debt to Equity was equally estimated at 154.27% as against 148.88% estimated in the comparable year, meaning that more debt was used in servicing the company’s assets through the period.
- It was also established that Equity is the same as 39.33% of Honeywell Flour Mills Assets Value, estimates from the 2020 full-year numbers yielded 40.18%.
- Nevertheless, we can safely conclude that Honeywell Flour Mills shares is fairly liquid and averagely patronized, although the estimated Beta stood slightly below our estimated industry average, and below market beta

Profitability Ratios
- EBITDA margin estimated for the period stood at 6.98%, slightly above the 6.83% estimated from 2020 full-year earnings numbers.
- The pre-Tax Margin on the other hand dropped by 8.88% to 1.44%, as against the 1.48% estimated at the end of the 2020 business session.
- Cost of Sales is 85.75% of the Turnover figure, which is only 3.60% slightly above the 82.77% estimated in 2020. This is a confirmation of the management’s effort at controlling the direct cost of running the business.
- Return on Equity stood at 1.94%, as against 1.14% of 2020.

Efficiency Ratios
- Operating Expenses to Turnover value is the same as 7.41%, which is a 29.75% improvement in efficiency during the year.
- Turnover to Total Assets Ratios stood at 74.35% from 56.55%, this is a 31.48% improvement in management efficiency when compared to estimate from 2020 full-year.
- See below for details

Investment/Valuation Ratios
- When compared with 2020 full-year numbers, earnings per share improved significantly to N0.14 from the previous estimate of N0.08 each.
- P/E-Ratio dropped by 31.82% to 8.31x from 12.19x in the previous year.
- The said Earnings per Share yielded 12.03% of the current market price of Honeywell Flour Mills shares on the floor of the exchange as at the time the result was made available to the investing public
- The Book Value of Honeywell Flour Mill is currently estimated at N7.31 per share, far above the market value of its shares on the floor of the exchange, and our Intrinsic Value.
- Confirming the under-priced status of Honeywell Flour Mills on the exchange is the Price to Book Value at below unity (0.16x)

Valuation
After considering the financials of Honeywell Flour Mills, we maintain our very conservative valuation approach; and observe that although the improvement in dividend payment was high when compared to the previous year’s payment, the sustainable growth rate is below unity (1). We, therefore, valued each unit of Flour Mills at N87and have rated it a Hold.
Five (5) Years Full Year Earnings History
| HONEYWELL FLOUR | |||||
| Company Numbers | |||||
| Year | 2021(000) | 2020(000) | 2019(000) | 2018(000) | 2017(000) |
| Date Released | 27-May-21 | 29-Jul-20 | 01-Jul-19 | 29-Jun-18 | 30-Jun-17 |
| Turnover | 109,594,730 | 80,450,397 | 74,409,113 | 71,476,319 | 53,227,891 |
| Cost of Sales | 93,973,456 | 66,588,559 | 62,899,939 | 55,423,670 | 40,515,629 |
| Operating Profit | 7,646,049 | 5,497,633 | 3,916,298 | 9,477,182 | 8,262,788 |
| Opex | 8,115,937 | 8,480,414 | 8,344,345 | 6,777,684 | 5,661,680 |
| Profit before Tax | 1,576,746 | 1,270,237 | 607,791 | 4,872,291 | 5,469,833 |
| Tax Expenses | 450,826 | 619,712 | 539,423 | 445,313 | 1,664,878 |
| Profit After Tax | 1,125,864 | 650,492 | 68,368 | 4,426,978 | 4,304,955 |
| Total Comprehensive Income | 1,125,864 | 650,492 | 752,116 | 4,532,811 | 3,967,384 |
| Current Assets | 45,936,677 | 36,891,364 | 30,846,383 | 21,611,089 | 13,011,890 |
| Non-Current Assets | 101,457,979 | 105,369,928 | 106,658,729 | 103,223,924 | 100,139,824 |
| Total Assets | 147,394,656 | 142,261,292 | 137,505,112 | 124,835,013 | 113,151,714 |
| Current Liabilities | 61,940,563 | 53,639,919 | 42,301,619 | 28,207,658 | 26,318,698 |
| Non-Current Liabilities | 27,485,415 | 31,461,351 | 38,535,524 | 40,236,091 | 34,498,351 |
| Total Liabilities | 89,425,978 | 85,101,270 | 80,837,143 | 68,443,749 | 60,817,049 |
| Retained Earnings | 15,425,942 | 13,827,705 | 46,240,829 | 45,964,524 | 41,907,525 |
| Net Assets | 57,968,678 | 57,160,022 | 56,667,969 | 56,391,644 | 52,334,665 |
| Dividend Paid | 0.07 | 0.04 | – | 0.06 | 0.06 |
| ESTIMATED RATIOS | |||||
| EPS | 0.14 | 0.08 | 0.01 | 0.56 | 0.54 |
| TCI/SHARE | 0.14 | 0.08 | 0.09 | 0.57 | 0.5 |
| PE/RATIO | 8.31 | 12.19 | 115.99 | 4.1 | 3.24 |
| EARNINGS YIELD | 12.03% | 8.20% | 0.86% | 24.38% | 30.84% |
| BOOK VALUE | 7.31 | 7.21 | 7.15 | 7.11 | 6.6 |
| PROFIT MARGIN | 1.03% | 0.81% | 0.09% | 6.19% | 8.09% |
| RETURN ON EQUITY | 1.94% | 1.14% | 0.12% | 7.85% | 8.23% |


