Rating: Hold
Current Market Price: N9.80
Latest Cash Dividend: N1.00
Year High: N17.60
Year Low: N8.95
Fair Value: N9.25
Equity Analyst: Tunde Segun Jeariogbe
Introduction
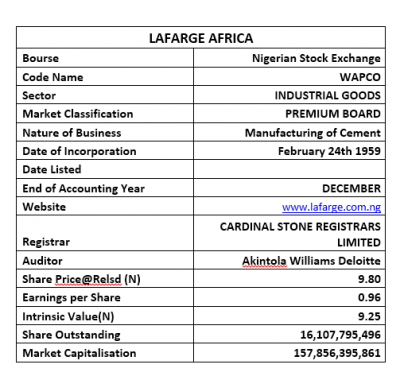
• This report is based on the financials of Lafarge Africa Plc for the year ended 31st December 2019 and compared it with that of 2018 to establish growth and projection, where necessary.
• We observed that the dividend proposed was made possible because of its outstanding earnings for the period under review, which was derived from the disposal of the company’s investment in Lafarge South Africa Holdings (LSAH) to Caricement B.V, a related party within the Lafarge Holcim Group.
• The said sale boosted the company’s Total Comprehensive Income to N7.14 as against the N0.96 Earning Per Share (EPS).
• It is noteworthy that the company employed a lower finance cost through the year which translated to a huge drop in its liabilities because it utilized part of the proceeds from the sale to augment its liabilities.
• In the report, the Directors proposed a dividend of N1.00 (2018: Nil) on every ordinary share in issue amounting to N16,107,795,721.00 (2018: Nil).
• The closure date for the said dividend is 4th to 8th May 2020, while the qualification date is 30th April 2020.
• According to the company, the dividend is payable on 26th May 2020 to all shareholders whose names appear in the register of members as of its closure date.
Statement of Comprehensive Income
• This report is based on the financials of Lafarge Africa Plc for the year ended 31st December 2019 and compared it with that of 2018 to establish growth and projection, where necessary.
• We observed that the dividend proposed was made possible because of its outstanding earnings for the period under review, which was derived from the disposal of the company’s investment in Lafarge South Africa Holdings (LSAH) to Caricement B.V, a related party within the Lafarge Holcim Group.
• The said sale boosted the company’s Total Comprehensive Income to N7.14 as against the N0.96 Earning Per Share (EPS).
• It is noteworthy that the company employed a lower finance cost through the year which translated to a huge drop in its liabilities because it utilized part of the proceeds from the sale to augment its liabilities.
• In the report, the Directors proposed a dividend of N1.00 (2018: Nil) on every ordinary share in issue amounting to N16,107,795,721.00 (2018: Nil).
• The closure date for the said dividend is 4th to 8th May 2020, while the qualification date is 30th April 2020.
• According to the company, the dividend is payable on 26th May 2020 to all shareholders whose names appear in the register of members as of its closure date.
Statement of Financial Position
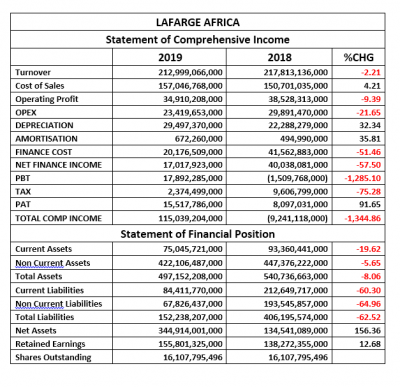
• Current Assets in 2019 stood at N75.04 billion, a 19.62% drop from the N93.36 billion estimated in 2018.
• Non-Current Assets, on the other hand, is estimated at N422.10 billion, versus N447.37 billion in 2018. Thus, Total Assets is jumped to N497.15 billion, as against N540.73 billion in the corresponding year.
• Similarly, Current Liabilities at the end of the year is estimated at N84.41 billion, 60.30% down from the previously estimated N212.64 billion.
• Non-Current Liabilities equally stood at N67.82 billion, the same as 64.96% below the N193.54 billion in the preceding year. Thus, Total Liabilities is valued at N152.23 billion against N406.19 billion.
• Net Assets is estimated at N344.91 billion, same as 156.36% above the previous estimate of N134.51 billion in 2018.
• Retained Earnings at the end of the year was worth N155.80 billion, or 12.68% above the N138.27 billion stated in its 2018 financial.
Financial Strength
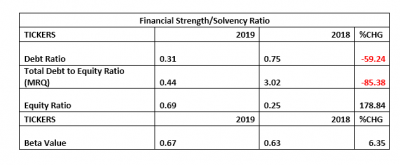
• Total Liabilities for the year under consideration is the same as 31% of the Total Assets figure for the year. In other words, the Debt Ratio is 0.31x, which is 59.24% below the 0.75x in the corresponding year.
• Total Debt to Equity Ratio is currently estimated at 0.44x as against 3.02x in the prior year, this implies that the Total Debt Value for the year can replicate Equity 0.44 times, this is a better position when compared to 3.02x of the previous year.
• Equity Ratio is also valued at 0.69x, versus 0.25x, which means Equity is the same as 69% of the Total Assets Value for the year. When compared to the 2018 estimate, it shows an improvement in the company’s financial strength.
• Going by the current estimated beta value, the shares of Lafarge Africa can be said to be less liquid, currently standing far below the market beta.
Profitability Ratio
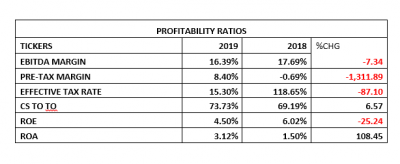
• EBITDA Margin is Currently estimated at 16.39% versus the 17.69% estimated at the end of the 2018 financial year.
• Pre-Tax Margin stood at 8.40% as against the negative margin of -0.69% in 2018.
• Cost of Sales is estimated to be 73.73% of the Turnover Figure, which is 6.57% higher than the 69.19% in the corresponding year.
Efficiency Ratio
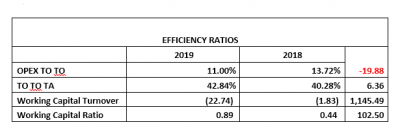
• Operating Expenses is estimated at 11.00% of the Turnover Value, an appreciable improvement in the management’s efficiency when compared to the 13.72% estimated in 2018
• Turnover Value is 42.84% of the Total Assets Value, the ratio is 6.36% above the 40.28% estimated from 2018 figures.
• At 22.74x Working Capital Turnover grew from the previously estimated 1.83x
• Working Capital Ratio, within the two compared years stood below unity and confirmed the firm’s weakness, when it relates to settling its current liabilities with current assets as and when due through the season.
Investment Ratios
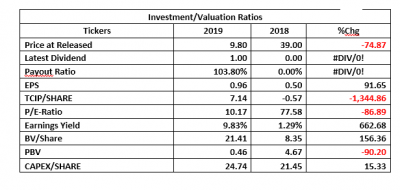
• Within the two periods compared, traders were seen largely revaluing the share price of Lafarge Africa on the Nigerian Stock Exchange as the price now stands at N9.80 (at the release of result), from N39.00 in the corresponding year.
• The estimated Earnings Per Share for Lafarge Africa is N0.96, which is far above the N0.50 earned at the end of 2018.
• Total Comprehensive Income is valued at N7.14, as against the loss of N0.57 in a similar period of 2018.
• Thus, of the Total Comprehensive Income, it proposed N1.00 cash dividend. Note that no dividend was paid in the corresponding year.
• The said dividend represents 103.80% of the amount earned per unit– EPS for the year. Meanwhile, it is 14.00% of the Total Comprehensive Income.
• P/E Ratio is currently estimated at 10.17x, compared to the previous 77.58x in 2018.
• At the price of Lafarge Africa when the result was released, the EPS had a positive yield of 9.83%, as against 1.29% in the previous year-end.
• The Book Value of Lafarge Africa is currently estimated at N21.41 higher than the N8.35 estimated from the previous year’s results. The difference resulted from the large drop in the liabilities indices which in-turn enhanced the Net Assets.
Valuation
• While valuing Lafarge Africa, we chose a highly conservative approach, especially in our projections of the income lines. We observed that the company still faces a very stiff challenge within its industry, and will require a proactive approach to surpass the current performance. Although it now works with reduced liabilities, we are of the opinion that the current economic situation which has led to a re-work of the Federal Government’s budget due to the crash in oil price, arising from the Coronavirus pandemic now ravaging the globe. This will tell largely on the company’s performance indices for 2020. Thus, on the strength of these and other key factors, we have valued each unit of Lafarge Africa for N9.25, thus we rated it a HOLD.


