LAFARGE AFRICA PLC:
Quarter Under Preview: 9-Months
Current Share Price: N134
Latest Final Dividend: N1.20
Latest Interim Dividend: N4
Estimated Beta Value: 0.05x
Estimated Fair Value: N150.00
Estimated Intrinsic Value: N71.68
Analyst: Jeariogbe Tunde Segun
The Company
Lafarge Africa PIc is a member of Huaxin Cement Co. Ltd – founded in 1907 and incorporated in China. Huaxin is listed on the Shanghai and on the Hong Kong stock exchanges. It is among the 10 largest cement manufacturing groups in the world.
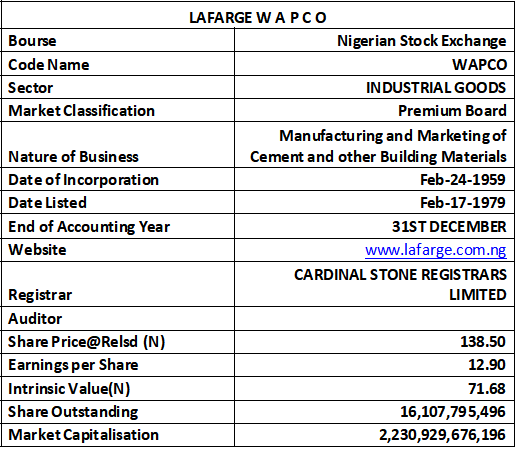
Lafarge Africa is a publicly quoted company on the Premium Board of the Nigerian Exchange Limited and serves Nigerians with a wide range of building and construction solutions. The giant cement company has four plants in Nigeria spread across Sagamu and Ewekoro, Ogun State (South-West), Ashaka in Gombe State (North-East), and Mfamosing, Cross River State (South-South), Lafarge Africa PIc currently has an installed cement production capacity of 10.5 million tons per annum.
The Released Financials
At the end of the first 9 months of the 2025 financial year, the management reported a turnover of N780.485 billion, 62.77% higher than the N479.495 billion achieved at the end of the corresponding period in 2024. Cost of Sales amounted to N324.360 billion, versus N241.730 billion in the similar period of last year. Operating Profit was estimated at N298.407 billion, as against N130.077 billion in 2024, while Operating Expenses was valued at N162.029 billion from N109.735 billion in the comparable period of 2024. Profit before Tax at the end of the period was N313.290 billion versus the prior N94.325 billion. Tax Expense is N105.509 billion from N34.250 billion in the similar quarter of last year. Consequently, profit for the year came to N207.780 billion against N60.075 billion achieved at the end of 2024 nine-month period. See the below table for details:
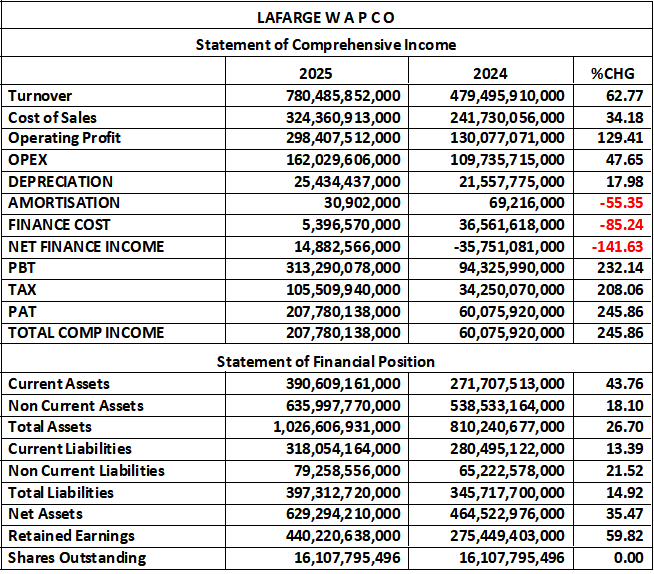
At the close of the period under analysis, the Current Assets of Lafarge Africa was valued at N390.609 billion against N271.707 billion, Non-Current Assets valuation was N635.997 billion versus N538.533 billion in the corresponding quarter. Thus, Total Assets of the giant cement company came to N1.026 trillion, which is 26.70% higher than the N810.240 billion value of last year. On the other hand, Current Liabilities was estimated at N318.054 billion versus N280.495 billion in the corresponding quarter, thus, Total Liabilities held till the end of the quarter is same as N397.312 billion against N345.714 billion. Net Assets is therefore estimated at N629.294 billion versus N464.522 billion, while the Retained Earnings Total is now N440.220 billion. See the above table for details.
Financial Strength Ratios
Debt Ratio: As shown in the table below, the ratio trended marginally south- from the previously estimated 42.67% to 38.70%. A lower debt ratio indicates that a smaller portion of the company’s assets are financed by liabilities.
The decline represents reduced leverage and stronger balance-sheet stability. Implications areL Improved solvency, Lower financial risk, and Greater capacity to withstand volatility in interest rates or cash flow fluctuations.
Total Debt to Equity Ratio: The Ratio equally adjusted down to 63.14% against the previously estimated 74.42% in the corresponding quarter. Note that a substantial decline in the debt-to-equity ratio means the company is less reliant on debt to finance its operations relative to shareholders’ equity. This signals Better capital structure, Reduced gearing and financial vulnerability, plus potential for improved investor confidence, as the firm becomes less risky. This reduction is material and indicates deliberate deleveraging or improved retained earnings.
Equity Ratio: The Equity Ratio equally moved higher to 61.30% as against 57.33% estimated at the end of the corresponding period of 2024. An increased equity ratio shows that more of the company’s assets are financed by equity rather than debt. The implications are: a stronger net worth position, improved solvency, greater long-term financial flexibility, and more room for future borrowing if needed. This aligns with the falling debt metrics, confirming an overall strengthening of the balance sheet.
Final Verdict:
Across all solvency indicators, Lafarge Africa Nigeria shows clear improvement in financial strength for the 9-month period ended Sept 2025:
Key Trend Summary
✔ Leverage reduced (debt ratio & D/E ratio dropped)
✔ Equity share of financing increased
✔ Balance sheet risk decreased
✔ Financial flexibility improved
✔ Low beta reinforces the company’s defensive risk profile
Overall, the company’s solvency position in 2025 is stronger and more resilient than in 2024.

Profitability Ratios
Lafarge Africa shows a substantial turnaround in profitability, with improvements across almost all profitability metrics. This indicates a `stronger operational performance, cost efficiency, and improved asset and equity utilization.
- EBITDA Margin: Is currently estimated at 38.23% versus 27.13% for a change of 40.94%. This implies;
A major improvement in EBITDA margin signals:
- Better cost control
- Increased operational efficiency
- Improved pricing power or product mix
- Lower operating expenses relative to revenue
This in-turn reflects stronger core business performance, independent of depreciation and financing effects.
- Pre-Tax Margin: The Ratio increased by 104.05% moving to 40.14% from 19.67% as shown in the table below, thus;
Pre-tax margin more than doubled, indicating:
- Strong improvement in profitability before taxes
- Possible reduction in finance costs (consistent with lower leverage)
- Higher operating income
This jump suggests significant margin expansion, possibly driven by:
- Higher selling prices
- Lower production costs
- Better energy cost management
- Deleveraging and lower interest expense
- Cost of Sales to Turnover: Estimated at 41.56% Versus 50.41% in the similar period of 2024.
A lower cost-to-turnover ratio means:
- Improved gross efficiency
- Lower cost of production relative to revenue
- Better operational cost management
This aligns with the rise in EBITDA margin and shows cost optimisation across production processes.
- Return on Equity (ROE): Currently Estimated at 33.02% against 12.93% in the corresponding quarter- a change of 155.30.
A dramatic increase in ROE indicates:
- Much higher net income for shareholders
- Enhanced profitability and efficiency of equity use
- Improved capital structure (less debt → less interest ↦ more profit flowing to equity)
An ROE above 30% is exceptionally strong, indicating value creation for investors.
- Return on Assets (ROA): Return now 20.24% against the estimated 7.41% in the previous third quarter
This improvement shows:
- Higher profitability per naira of total assets
- Better asset utilisation and operational efficiency
- Higher net income relative to the asset base
This is evidence of strong operational turnaround and improved productivity.
Key takeaways:
- Margins expanded sharply across EBITDA and pre-tax levels
- Cost structure improved—lower cost-to-turnover
- Tax efficiency increased
- ROE and ROA surged, demonstrating:
- Improved earnings
- Better use of assets
- Stronger returns to shareholders
Final Verdict: The 2025 profitability metrics of Lafarge Africa Plc indicate major operational and financial improvements. When combined with the earlier solvency analysis (lower leverage, higher equity ratio), this paints a picture of a company that is:
- More efficient,
- More profitable, and
- Financially stronger than the prior year.

Efficiency Ratios
1. OPEX to Turnover (OPEX/TO): The Ratio adjusted slightly down as it stands at 20.76% from 22.89% at the end of the quarter. A lower OPEX-to-Turnover ratio indicates that operating expenses consumed a smaller share of revenue due to;
- Better cost control
- Higher operational efficiency
- Possible reductions in administrative, selling, or marketing expenses
- Supportive of margin expansion seen in EBITDA and pre-tax margins
This decline reinforces the broader narrative of cost discipline and improved profitability in 2025.
2. Turnover to Total Assets – Asset Turnover: Now estimated at 76.03% against 59.18%. The strong increase in asset turnover shows the company generated much more revenue from its asset base in 2025 compared to 2024.
What this means is:
- Improved productivity of assets
- Higher operational utilisation of plants, equipment, and investments
- Enhanced efficiency in deploying capital
- Supports the sharp rise in ROA
This aligns with the profitability improvements and shows Lafarge Africa is using its resources more effectively.
Thus, the ratios signify; strong operational improvement
Key highlights:
- Lower operating expense burden
- Better use of total assets to generate revenue
- Efficiency improvements reinforce profitability gains
- Supports the narrative of a stronger, leaner, more productive organisation in 2025
Final Verdict: Operational efficiency, cost discipline, and asset utilisation all moved in the right direction, making Lafarge Africa far more effective at converting inputs into revenue and profit.

Investment Ratios
The 2025 valuation metrics show a company experiencing strong earnings growth, increased investor demand, and a rerating of share value, although the P/E and earnings yield show mild compression due to higher market price.
1. Share Price at Result Release Date: ₦138.50 Versus ₦37.00 for a percentage Change of 274.32%. The share price almost quadrupled, reflecting: Strong investor confidence, Improved financial performance, Potential sector re-rating, Market recognition of improved earnings quality, and Reduced leverage plus stronger margins (from earlier analyses). This shows substantial capital appreciation for shareholders.
2. EPS (Earnings Per Share): ₦12.90 Versus ₦3.73 for a percentage change of 245.86%
Interpretation:
- EPS surged significantly due to:
- Higher net profit
- Improved pre-tax and EBITDA margins
- Lower effective tax rate
- Lower finance cost due to deleveraging
The earnings growth is fundamental-driven, not one-off, given the improvements in operational metrics.
3. P/E Ratio: Now 10.74x from 9.92x, a slight expansion of 8.23%: Despite a 274% increase in share price, the P/E ratio increased only slightly.
This means earnings grew almost as fast as the share price, keeping valuation reasonable.
Implications:
- The market is not overpaying for the stock
- The price movement is justified by strong earnings growth
- Shares remain within fair valuation range for the cement sector in Nigeria
- A P/E of 10.74x is still conservative, suggesting further upside potential.
4. Earnings Yield; Now 9.31% against 10.08%, for a Change of 7.60%.
Interpretation
- Earnings yield dropped slightly because:
- Share price rose faster than yield
- The stock became more expensive relative to earnings—but only marginally
Despite the drop, a 9.31% earnings yield is still very attractive in the Nigerian market, especially compared with:
- Money market yields
- Government bonds
- Sector peers
This signals the stock still has strong value characteristics.
- Book Value per Share (BV/Share): Now estimated at ₦39.07 from ₦28.84 for a percentage change of 35.47%
Interpretation
- A rising book value per share indicates:
- Growth in shareholders’ equity
- Retention of earnings
- Strong capital accumulation
- A healthier balance sheet
This is consistent with:
- Reduced debt levels
- Higher net income and improved retained earnings
- Improved equity ratio from solvency analysis
Final Verdict: Strong market rerating driven by fundamental performance
Key observations from this are:
- Share price surged, revealing that market confidence has risen sharply
- EPS & Comprehensive income per share jumped over 240%, implying strong earnings momentum
- P/E ratio remains modest (10.74×), that is; the stock remains fairly valued
- Earnings yield is still strong, which is attractive for value investors
- BV/share rising, implying stronger financial foundation
- Capital appreciation plus earnings growth shows a very strong total return picture
Lafarge Africa is experiencing: A fundamental-driven valuation uplift. A re-rating by the market due to restored profitability, better solvency, and improved efficiency. The valuation ratios confirm that 2025 represents a significant turnaround year with both operational and market performance improving substantially.

Overall Verdict on Lafarge Africa
Lafarge Africa in 2025 is financially stronger, more profitable, more efficient, and strategically better positioned than in 2024. The turnaround is supported by fundamentals, not one-off events. Investor sentiment and valuation metrics confirm that the company is in a growth and re-rating phase.
Based on the reviewed 2025 earnings strength, rseasonable P/E benchmarks, and Improving fundamentals, plus ppersistent undervaluation relative to ROE and sector norms. A conservative fair value midpoint is around N150/share. Nevertheless, our estimated intrinsic value is far lower than the current market price at N71.68. This is based purely on sustainable ROE of 20%, the market may be pricing in higher growth or ROE continuation. If we assumed a higher long-term sustainable ROE (e.g., 25–30%), intrinsic value would move closer to the market price.


