The Nigerian Exchange had a mixed performance last week, as stockbrokers crossed over 467m shares valued at N9.59bn in 10,659 deals, while market capitalization closed at N59.4tr, reflecting strong activity in the market during the period.
Although there were positive movements in some segments of the market, last week’s decline was more intense. Downturns are a natural part of market dynamics and can present good buying opportunities, especially for companies with strong fundamentals. Investors should use fundamental analysis to assess a company’s value, just as technical analysis would help determine the right time for entry or exit. Successful investing requires understanding both, in addition to what you should buy, and when.
NGXASI Weekly Chart (Opening)
Leading the top gainers chart this week was Eunisell, a stock worth N1.94bn by market capitalisation, which has been on a strong upward trajectory for the past three weeks. The share price of Eunisell, a company that specializes in developing, manufacturing, and marketing polymeric, metallic, and porcelain products, surged by 60.72%, closing at N19.27 each. Following closely was Tantalizer with 57.33%, closing at N1.18 per share; ahead of John Holt’s 42.49% notch, closing at N11.00 each.
Similarly, Austin Laz saw a share price growth of 34.34%, closing at N2.66, while Wapco surged by 28.57% to N54.00 each.
On the other hand, the decliners chart was led by Mecure Plc which lost 18.53% of its market capitalisation, closing at N10.55. Multiverse fell by 11.62%; and University Press which declined by 11.62%, closing at N3.50. The Initial Plc also saw a drop of 11.07%, closing at N2.25.
Trending in the Economy: Nigeria’s inflation rate continued its upward trajectory, reaching a concerning 33.88% as of October 2024, with food inflation, a key driver of the overall trend surging to 39.16%, and in the process piling more pressure on household budgets and the overall economy.
Purchasing Manager Index (PMI) for the month revealed contracting economic activities in the nation’s business environment according to data by the CBN and Stanbic IBTC. The PMI figure slipped to 49.6 points from 50.50 point in September.
Global stocks posted a solid weekly gain on Friday, while U.S. Treasury yields eased as investors focused on the potential effects of President-elect Donald Trump’s policies on the U.S. economy. These policies are expected to include tariffs, tax cuts, and deregulation, with markets closely watching his appointments, particularly for Treasury Secretary. Despite concerns over inflationary pressures, all three major U.S. stock indexes finished higher, each recording a weekly gain. The Dow Jones Industrial Average surged by 0.97%, closing at 44,296.51; the S&P 500 rose 0.35%, finishing at 5,969.34; while the Nasdaq Composite gained 0.16%, ending at 19,003.65.
In Europe, the Stoxx 600 index ended the week 1% up, breaking a four-week losing streak. MSCI’s global stock index rose 0.33% to 854.22, marking a 1.4% gain for the week. U.S. 10-year Treasury yields fell by 1.4 basis points to 4.418%, as markets adjusted expectations regarding future rate cuts by the Federal Reserve, amid concerns that some of Trump’s policies could be inflationary. A key measure of U.S. manufacturing, compiled by S&P Global, rose to 55.3, the highest level since April 2022. In contrast, the euro zone’s manufacturing gauge dropped to a 10-month low of 48.1 in November.
The U.S. dollar strengthened, with the dollar index rising 0.43% to 107.52, while the euro fell 0.56% to $1.0414, after dipping to $1.0333, its lowest level since Nov. 2022. Oil prices climbed about 1%, reaching a two-week high, amid escalating tensions in the Russia-Ukraine conflict. Brent crude rose 1.3% to $75.17 per barrel, while U.S. West Texas Intermediate (WTI) crude gained 1.6%, settling at $71.24.
NGX Banking Index Weekly Chart

NGX Insurance Index Weekly Chart

NGX Consumer Goods Index Weekly Chart

NGX Industrial Goods Index Weekly Chart

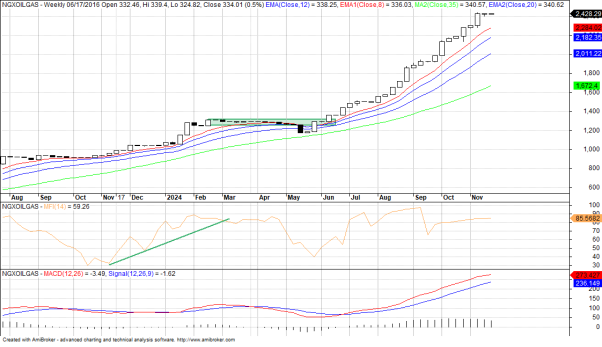
NGX Oil & Gas Index Weekly Chart

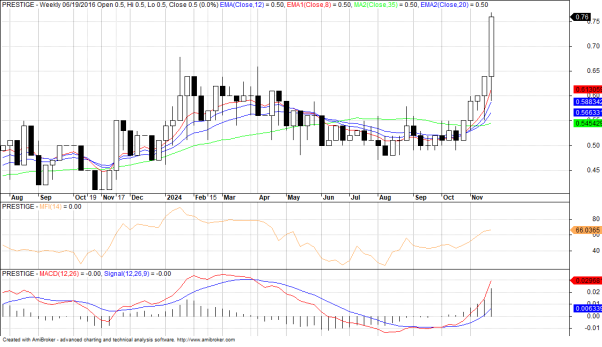
Prestige Assurance Weekly Chart

NEM Insurance Weekly Chart

CWG Weekly Chart


