It was a bearish week on the Nigerian Exchange, as the composite All-Share index failed to breakout the strong resistance level of 109,893 after forming a topping reversal chart pattern that signal pullback as witnessed over the period under review, not minding that a few stocks made new 52-week high in the face of profit taking and selling pressure that pervaded low, medium and large cap stocks.
Trading for the week started on a negative note, halting the previous gain. This was short-lived on Tuesday when the index recovered by a marginal 0.03% gain, a positive momentum that didn’t last, after the benchmark NGX All-Share index lost 0.10% at the midweek. The downtrend was extended to Thursday and Friday with the market shedding 0.40% and 0.14% respectively, bringing the week’s cumulative loss to 0.62%, as the NGX All-Share index closed at 109,028.62 points while market capitalisation settled lower at N68.752tr. Year-to-date gain by the All- Share Index dropped to 5.93%. The NGX 30 was up by 5.71%, the Banking Index, 6.59%, the Pension Index by 13.97%. The Insurance Index lost 5.59%; Consumer Goods Index increase by 32.43%, while the Oil and Gas Index recorded a negative return of 12.39%. In terms of market breadth, 52 stocks advanced, while 41 declined.
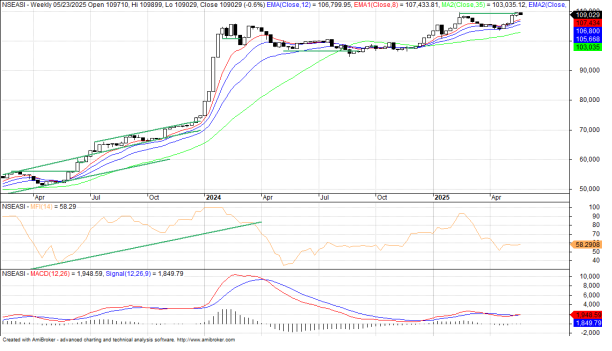
NGXASI Weekly Chart (Opening Chart)
The NGX index’s action on a weekly chart formed a double top that supports pullbacks which signalled a distribution phase that ushers in the onset of a declining market, despite the seeming buying interest in the midst selling sentiment that halted the four consecutive weeks of bullish momentum and transition. On the weekly time frame, MACD remains bullish while MFI is looking up to read 58.29 points which indicates are funds are entering the market. This need confirmation in last trading week of May.
NGXASI Daily Chart

Looking at the index action, the NGX benchmark index recently dropped below its 8-day exponential moving average (EMA), a key technical indicator serving as an auxiliary support and resistance line. This breach signals a shift in market momentum and suggests a potential corrective phase. Analysts expect a retracement toward the 108,000-point level as initial support. If this fails, the market could fall further to the psychological 106,000-point mark, testing investor confidence.
This technical weakness aligns with notable capital outflows from equities, as reflected by the money flow index reading of 64.27, indicating rising risk aversion among investors. With inflation pressures mounting and economic uncertainty persisting, many are doubtful if the stock market can deliver real positive returns by year-end(returns that exceed current inflation and protect purchasing power).
The recent decision by monetary authorities to keep policy rates unchanged has provided some market stability, helping to prevent a further decline and calming investor nerves amid volatility.
Meanwhile, value investors are turning their focus to alternative opportunities outside equities. The fixed income market, especially the 365-day Treasury bills, has seen a slight increase in yields, making it a more attractive and safer option for capital preservation.
In light of these conditions, investors are advised to practice regular portfolio rebalancing and rotation, while seeking undervalued stocks with strong technical and fundamental qualities. These strategies can help manage risk and position portfolios to benefit when market conditions improve.
Cutix Weekly Chart

Cutix PLC, a Nigerian-based manufacturer specialising in electrical cables and wires led the week’s gainers. Its share price opened at N2.60 and closed at N3.17, recording a gain of N0.57 or 21.92%. Custodian Investment PLC followed closely, rising by N3.85 or 21.45% as the stock moved from an opening price of N17.95 to close at N21.80. Red Star Express PLC appreciated by N1.16, representing a 20.90% increase from N5.55 to N6.71. John Holt PLC also witnessed a strong upward movement, gaining N1.30 or 20.63% as the price advanced from N6.30 to N7.60. Eunisell Interlinked PLC rounded out the top five gainers with a N2.20 gain, representing a 20.47% increase from its opening price of N10.75 to a closing price of N12.95.
Neimeth Pharm Weekly Chart

On the decliners chart, Neimeth International Pharmaceuticals PLC, a Nigerian pharmaceutical company, lost N0.63 or 17.03%, as it dropped from N3.70 to N3.07. Associated Bus Company PLC also saw a setback, falling by N0.46 or 15.59% from N2.95 to N2.49. Transcorp Hotels PLC experienced a major dip of N24.50, representing a 15.03% decline from its opening price of N163.00 to close at N138.50. NPF Microfinance Bank PLC slipped by N0.33 or 12.79%, moving from N2.58 to N2.25, while FTN Cocoa Processors PLC dropped by N0.31 or 11.97%, declining from N2.59 to N2.28
Market outlook
Despite the day’s overall dip, the All- Share Index appears to be holding a steady above the 109,000 psychological line, as continued sector rotation and portfolio rebalancing among mid-and large-cap stocks could provide the momentum needed to push the market back onto a bullish trajectory in no distance time. Especially as the market is entering the last month of the quarter that will usher in Q2 earnings season.
Trending in the Economy: Nigeria’s economy is expected to grow by 3.2%–3.5% in Q1 2025, driven by non-oil sector recovery, FX stability, and banking recapitalization. Growth is supported by strong performance in finance, ICT, and trade, as investor confidence improves. However, inflation, insecurity, and low oil output still pose risks to the outlook.
Again, the Central Bank maintained the interest rate at 27.5%, citing improving macroeconomic conditions. This follows earlier rate hikes to combat inflation after subsidy cuts and currency devaluation. Though inflation dropped from 34.8% in December to 24.5% in January after data rebasing, pressures persist due to high electricity costs and FX instability. The CBN acknowledged efforts to boost local production but flagged concerns over falling oil prices and global trade risks.
Global Market and Oil: U.S. stocks and the dollar slipped on Friday after President Trump proposed a 50% tariff on EU imports starting June 1 and floated a 25% tariff on iPhones made outside the U.S. Apple shares fell 3%, dragging major indexes lower, though they ended off session lows. European markets also closed weaker.
The dollar index hit a three-week low, falling 1.9% for the week—its biggest drop since early April. It lost 1% against the yen, while the euro gained 0.8%. U.S. and European bonds rose as investors sought safety amid concerns over Trump’s tax cuts and rising U.S. debt, now projected to grow by nearly $4 trillion under a new tax bill.
Trump criticized the EU on Truth Social, claiming it was created to exploit the U.S. The market reacted strongly to the iPhone tariff surprise, viewing it as a shift toward a more aggressive trade stance. For the day, the Dow fell 0.61%, the S&P 500 lost 0.67%, and the Nasdaq dropped 1%. Weekly losses ranged between 2.47% and 2.61%. Global and European stocks also declined. Markets saw volatility as Trump paused many earlier tariffs but kept a 10% baseline on most imports and trimmed Chinese tariffs to 30%. Bond yields fell amid renewed trade tension, with the 10-year yield at 4.517% and the 30-year at 5.042%. Gold climbed 2.14% to $3,364.74 on safe-have demand.
Oil prices edged higher on Friday as U.S. traders closed out positions ahead of the extended Memorial Day weekend, driven by concerns surrounding the ongoing nuclear negotiations between the United States and Iran. Brent crude futures rose by 34 cents, or 0.54%, to close at $64.78 per barrel, while U.S. West Texas Intermediate (WTI) crude futures gained 33 cents, also up 0.54%, to settle at $61.53 per barrel.
Sectorial Indexes Chart For The Week
NGX Banking Index Weekly Chart

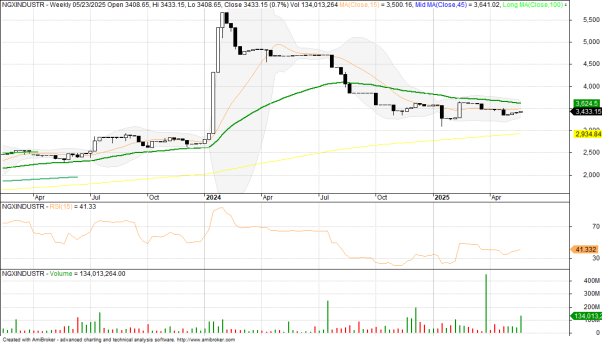
NGX Industrial Goods Index Weekly Chart
NGX Consumer Goods Index Weekly Chart

NGX Insurance Index Weekly Chart

NGX Oil & Gas Index Weekly Chart

NGX 30 Index Weekly Chart


