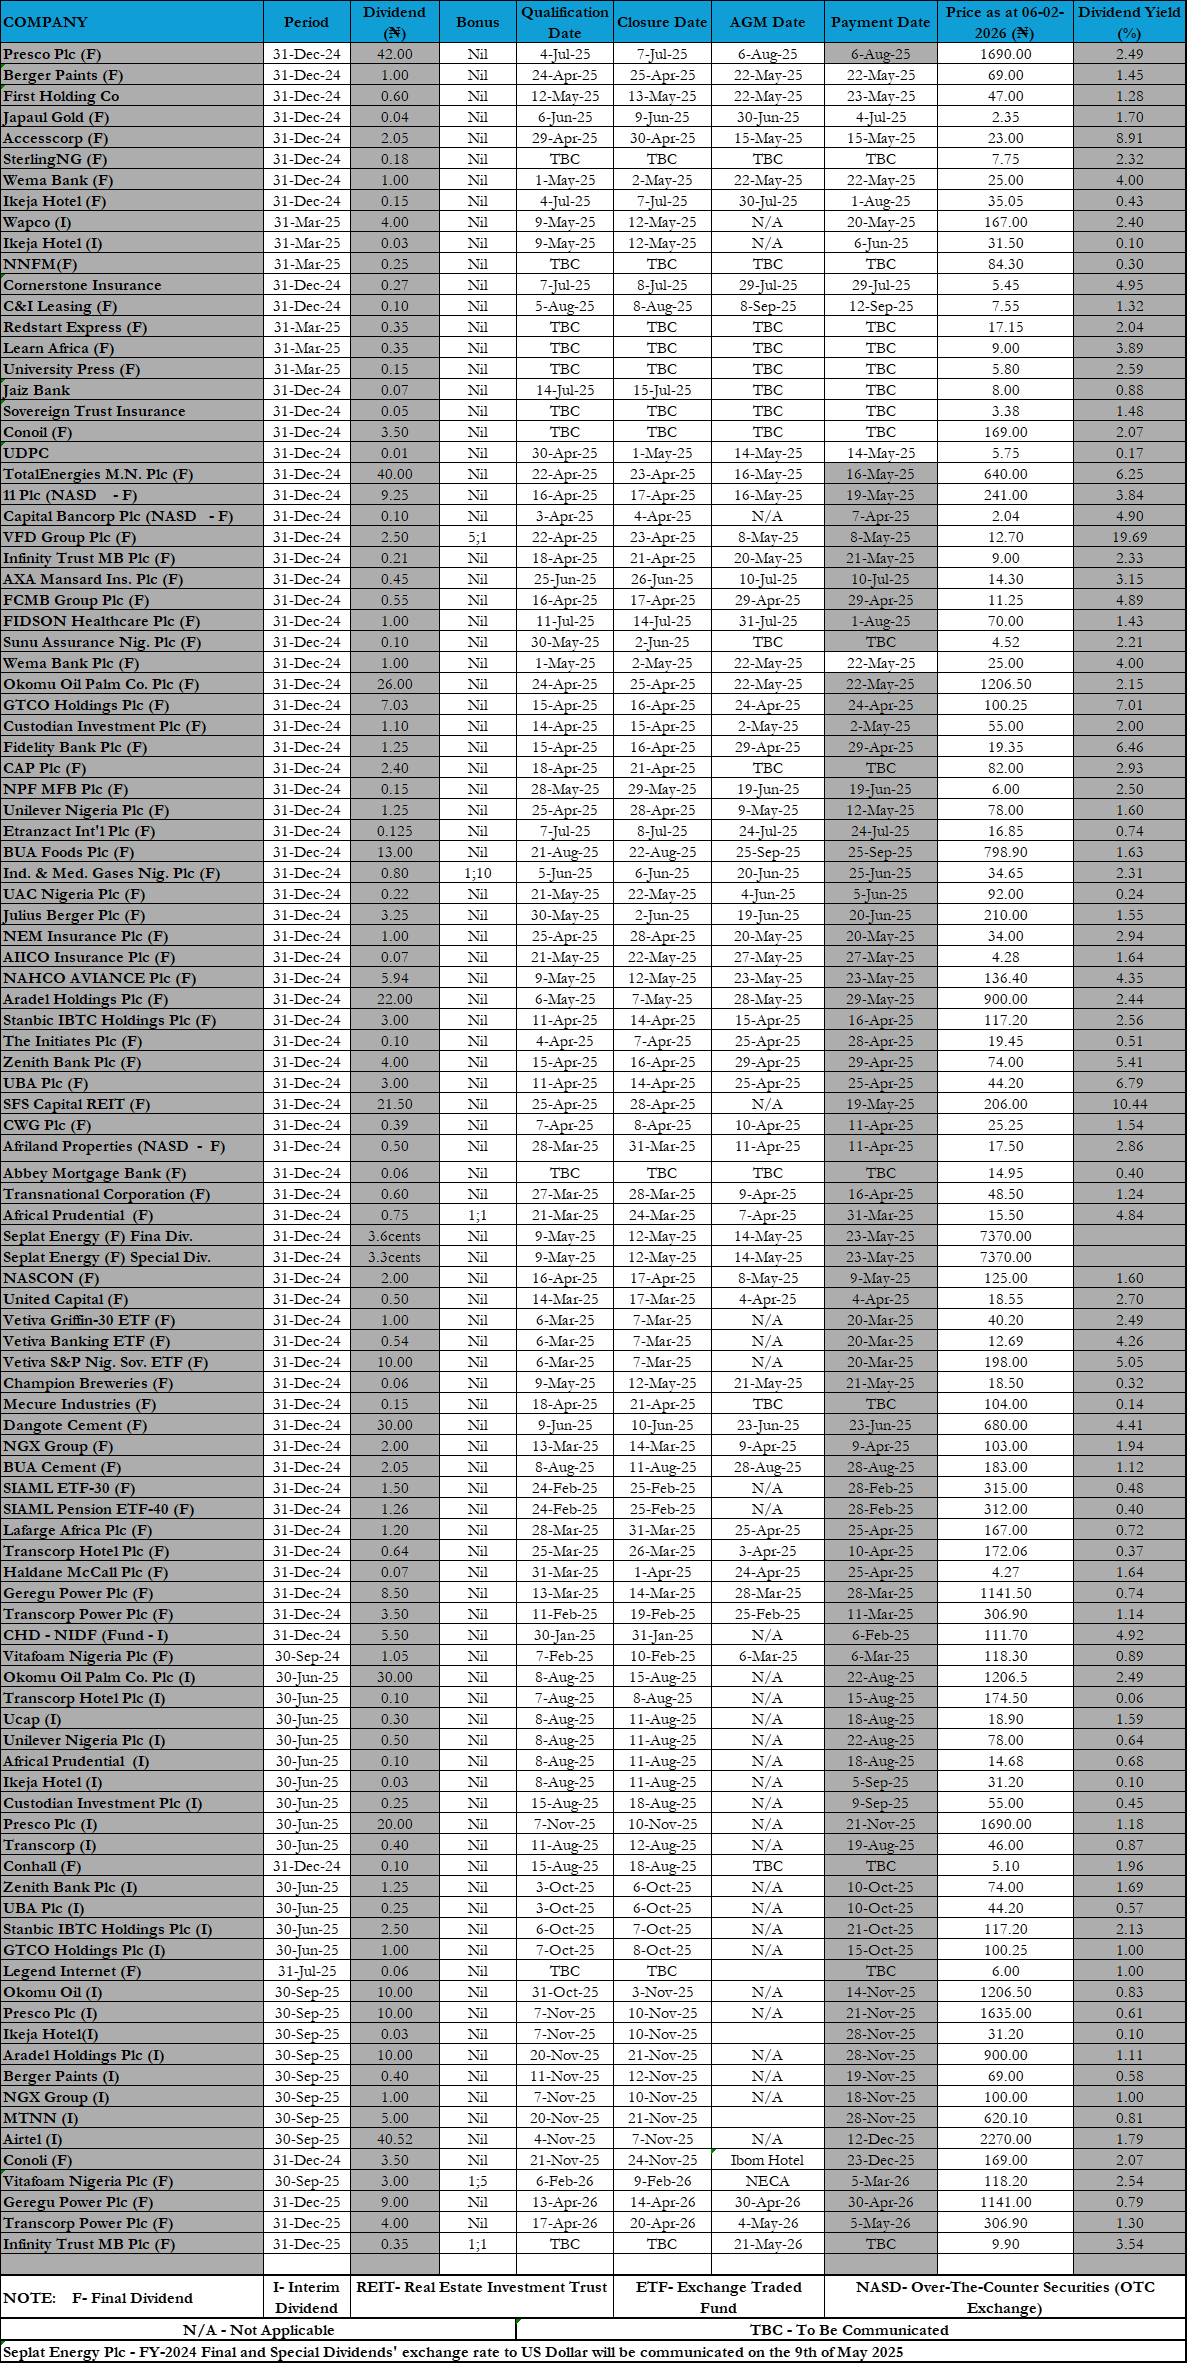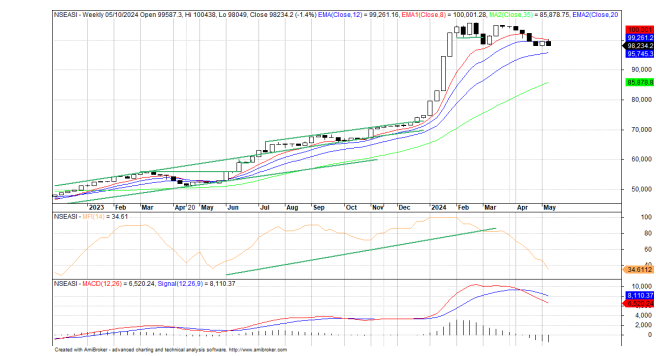
Bearish sentiment held sway last week, following the selloffs in Airtel Africa and others that pulled the benchmark NGX All-Share index lower on an above average traded volume and negative market internals in the face of selling sentiments and mixed Q1 corporate earnings. Dividend investing continued on qualification and payment dates to guide investors and traders as they jump into positions, as dividend income provide liquidity, as market players reinvest their dividends. In equity investing, successful players combine fundamentals and technical for profitable trading decision, as strong earnings is another reason for buying and selling stocks. Already, momentum and sentiment reveal market players psychology in any market condition.
Moving average is one of the most commonly used indicators in technical analysis, so let us look at it. People ask a lot about moving averages and think they are this incredible indicator that will lead to riches. Unfortunately, they are the farthest thing from that, being just invisible lines that people like to paint in different colours to exaggerate their meaning. There are all different kinds of moving averages: some are shorter-term, others are longer-term. There are those that give more weight to recent prices, while others are weighted equally.
I like to say that if you have enough moving averages on your screen, one of them will work. Today I would like to share with you in simple terms how I use them: A moving average is simply a smoothing mechanism for changes in price. That’s all it is.
A simple moving average is a lagging indicator that we only use to help with the trend recognition process. We consider it to be an invisible line, meaning that there is no direct relationship with price history. Support and resistance levels are based on previous exchanges of stock shares (or any asset) between buyers and sellers. Since a moving average is just a smoothing mechanism, meaning it smooths out the period to period price fluctuations (noise), the classic principles of polarity do not apply
As a definition, a simple moving average is just an unweighted mean of a given set of values. For example, a 200-day simple moving average takes the average closing price over the previous 200 days. After each new day’s close, the data from 200 days ago gets removed from the calculation and the most recent day’s closing price is added. This is plotted at the end of each period so it creates a line over a period of time. This is why they call it a “moving” average. Below are indexes and price actions to watch.
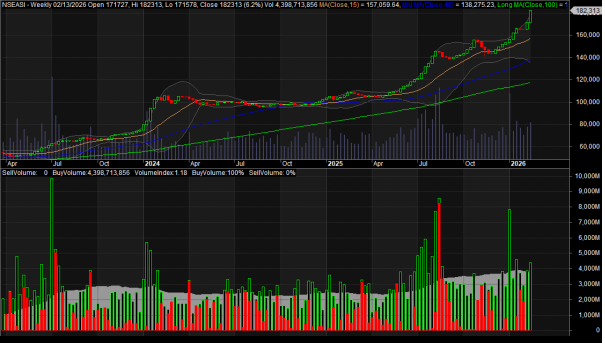
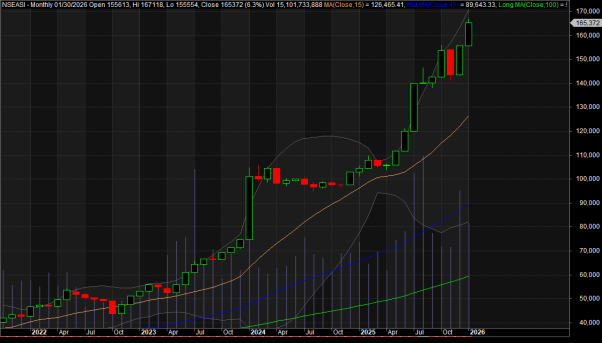
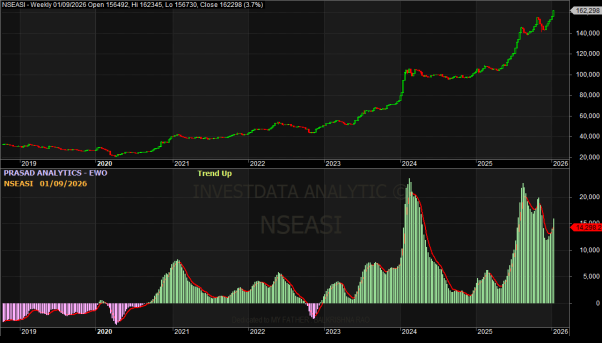
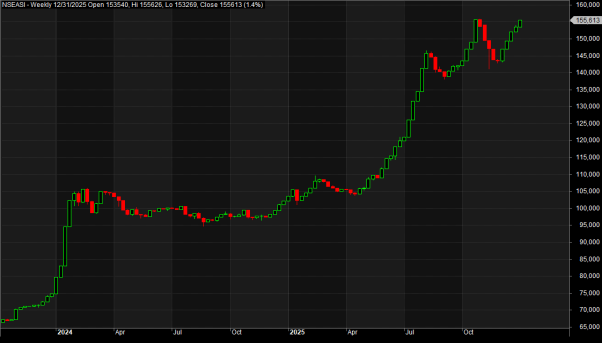
NGXASI Weekly Chart (Opening chart)
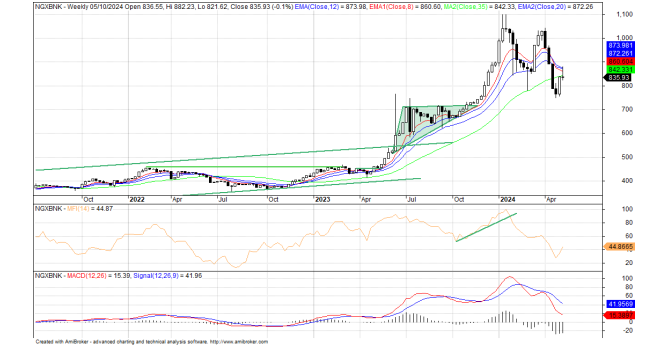
NGX Banking Weekly Chart
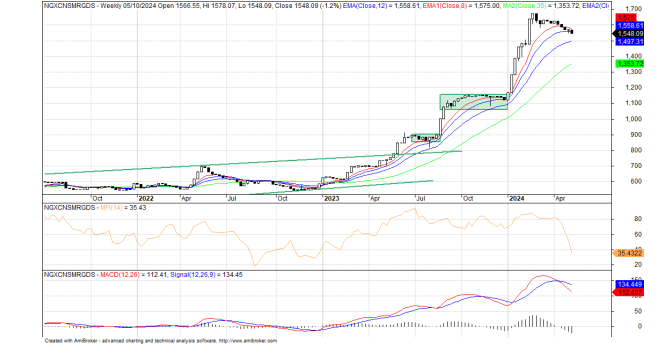
NGX CONSUMER GOODS Weekly Chart
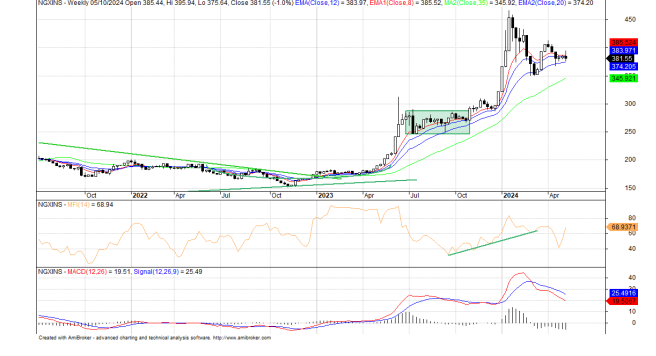
NGX Insurance Weekly Chart
NGX Industrial Goods Weekly Chart
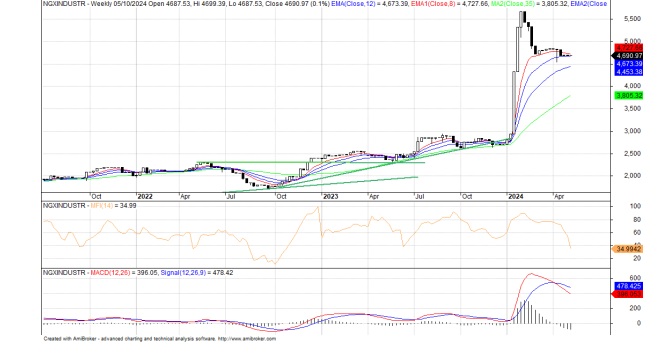
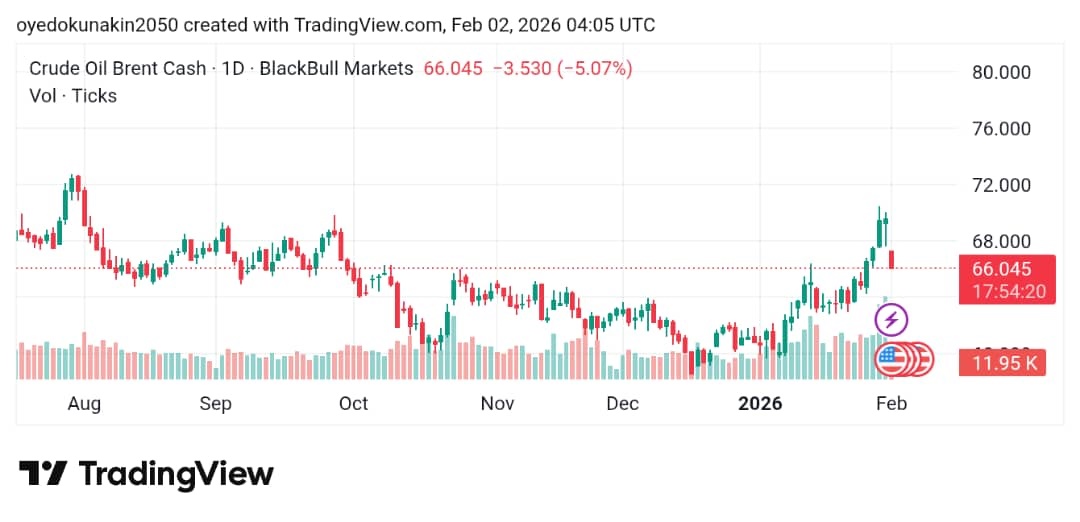
NGX Oil/Gas Weekly Chart
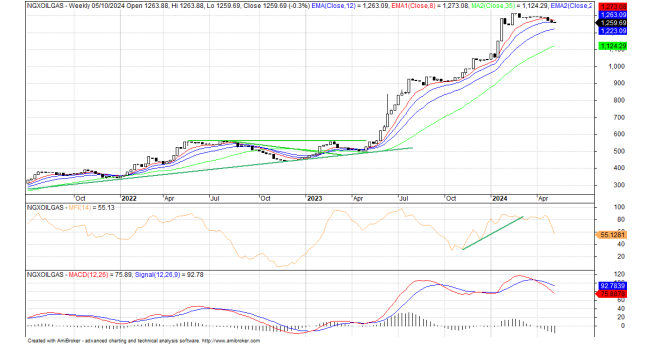
AXA Mansard Insurance Weekly Chart
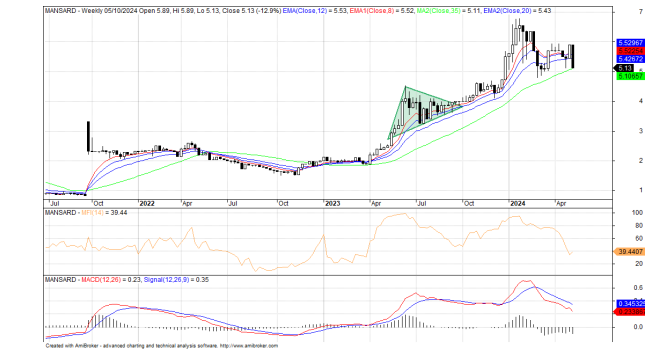
Zenith Bank Weekly Chart
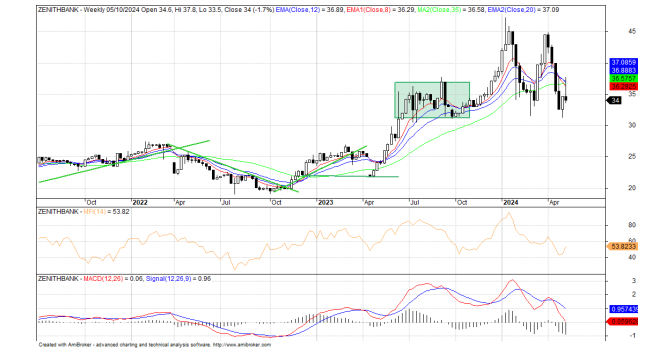
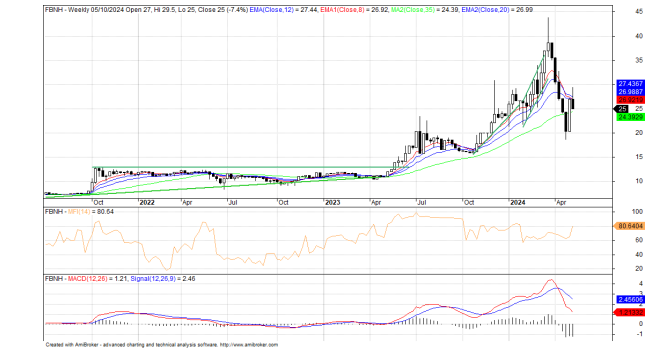
FBNH Weekly Chart
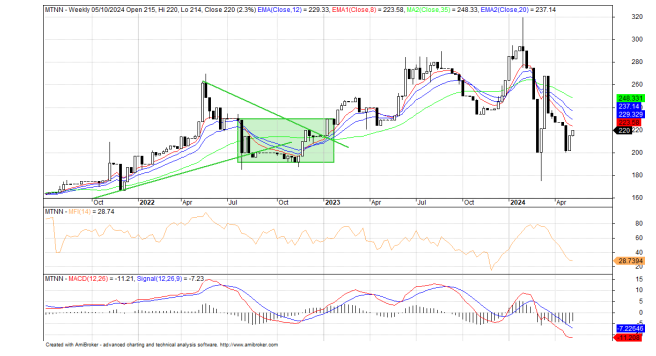
MTN NIGERIA
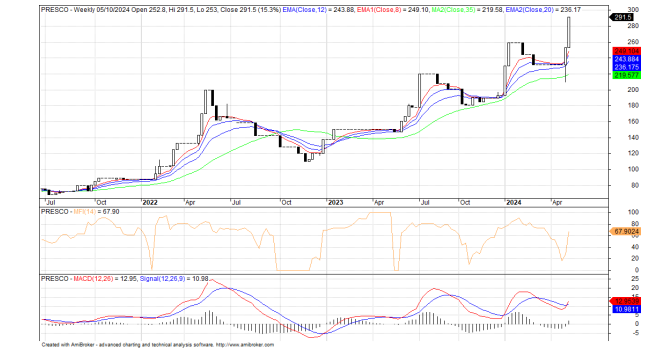
Presco Week Chart
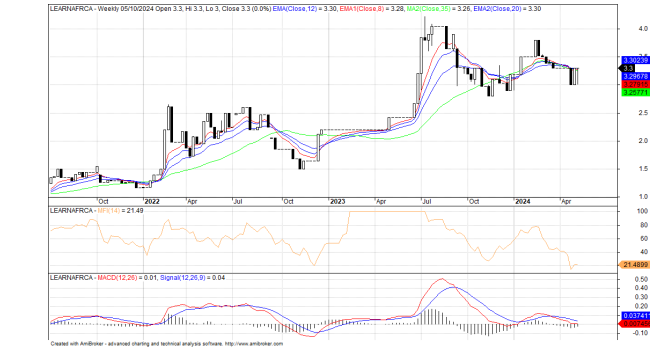
Learn Africa Weekly
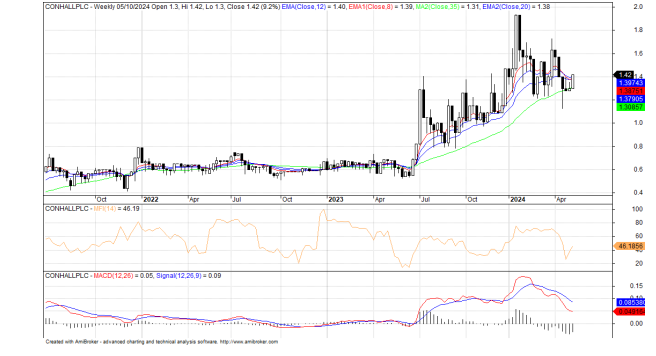
Consolidated Hallmark Insurance Plc Weekly Chart
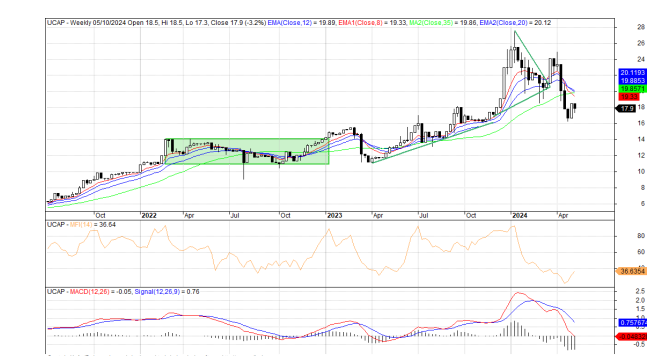
United Capital Weekly Chart
