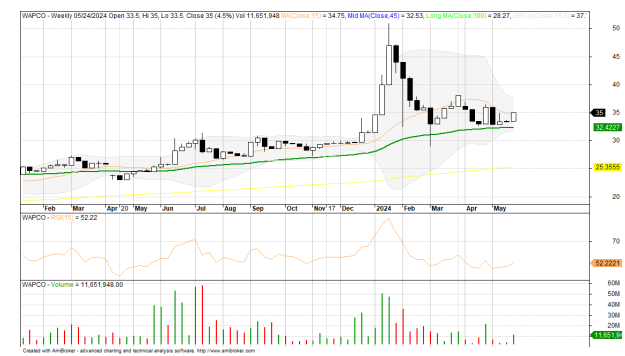
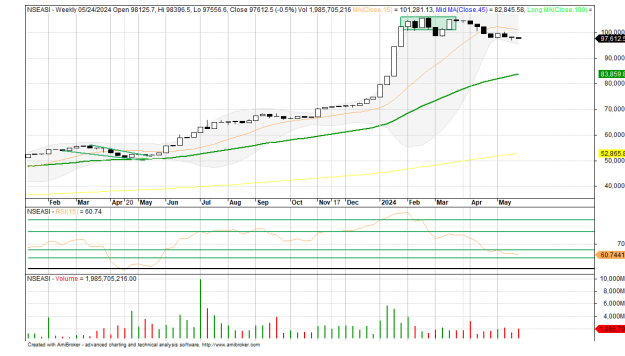
Volatility is one stock market dynamics that create opportunities to buy low and sell high. It comes in different ways and forms, whether as correction or pullback after the market has witnessed some rallies or bullish run and entered into the supply zone or overbought region. The market corrects by experiencing the markdown or decline phase when it proceeds to the demand zone which often times is the support level of a stock or even the general market.
Consequently, one thing we know for sure is that stock prices go up and down. Sometimes they go up in unison, and at other times most of them trade lower at the same time. In most cases, however, some stocks are rising while others are not, and could even be falling. We call these normal markets.
In fact, Banking stocks had suffered losses since another round of rate hikes started in March 2024 by the monetary authority in the name of checkmating inflation which instead of falling in reaction to the CBN effort, is making new all highs on a monthly basis. The persistent rise in inflation after the CBN hiked its Monetary Policy Rate by 750 basis points in just five months of the year is a pointer that it may be administering the wrong prescription and therefore needs a second opinion in the language of medical doctors.
This policy direction of CBN has, so far, fuelled inflation and economic contraction instead of curing it, due to the high-cost funds among others resulting from the high cost of energy, imported inflation linked to foreign exchange market challenges, insecurity that has prevented access to farmlands, high cost of transportation that makes the movement of goods and farm produce exorbitant even during harvest session and off session.
The prevailing bearish sentiment in the equity space is a result of the circular flow of funds looking for a higher return with less risk, and the higher yields in fixed income instruments are offering due to high interest rates amid the midst runaway inflation and declining economy.
As sector rotation and portfolio rebalancing persists, let the index and price actions guide your decisions.
NGXASI Weekly Chart (Opening Chart)
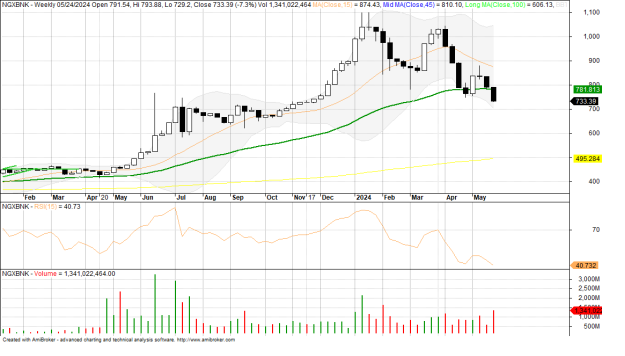
NGX BNK Index Weekly Chart
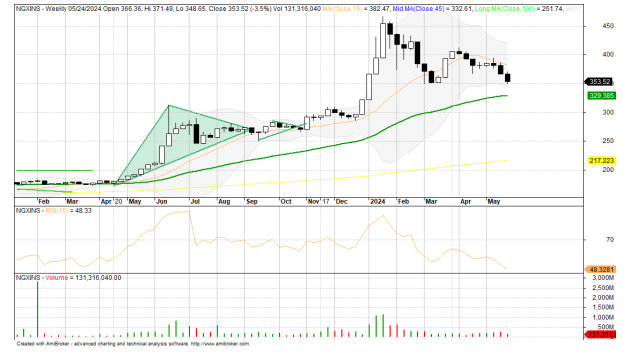
NGX Insurance Index Weekly Chart
NGX Consumer Goods Index Weekly Chart
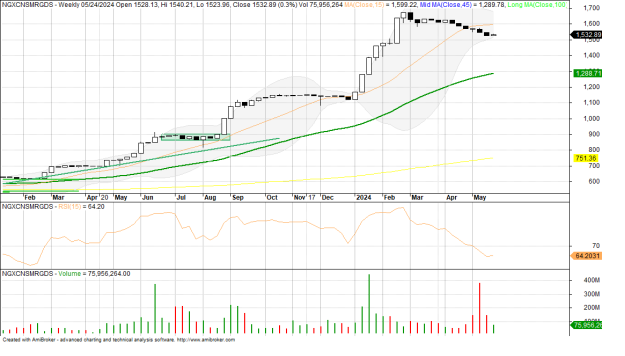
NGX Industrial Goods Index Weekly Chart
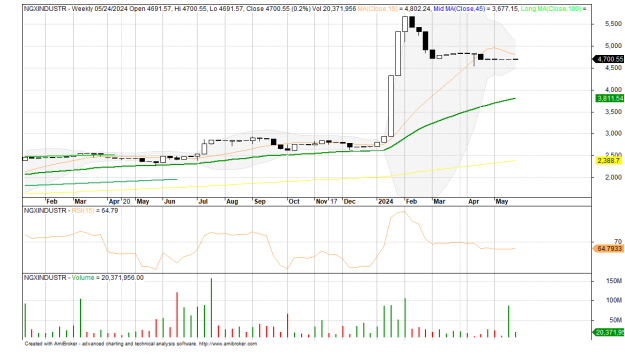
NGX Oil/Gas Index Weekly Chart
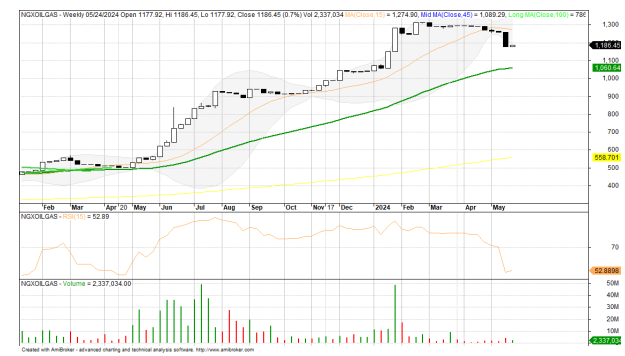
FBNH Weekly Chart
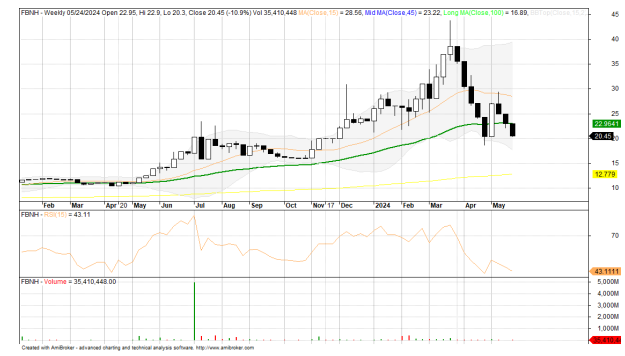
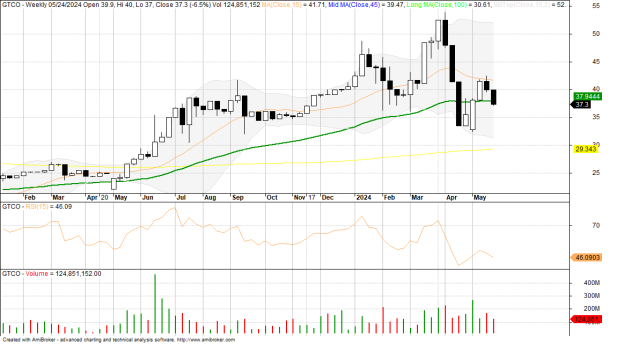
GTCO Weekly Chart
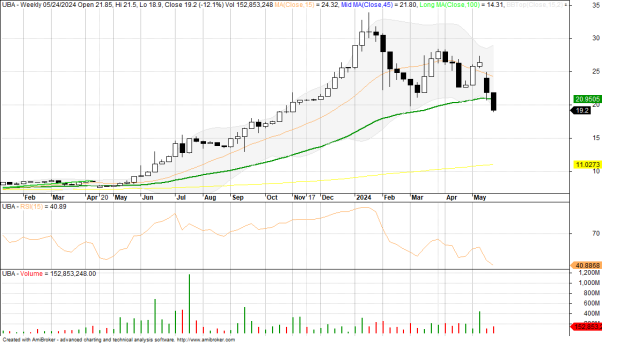
UBA Weekly Chart
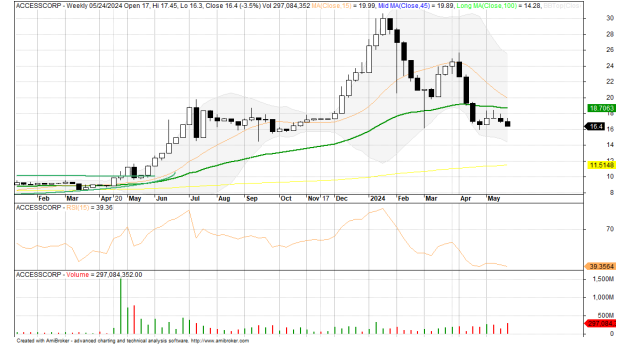
Accesscorp Weekly Chart
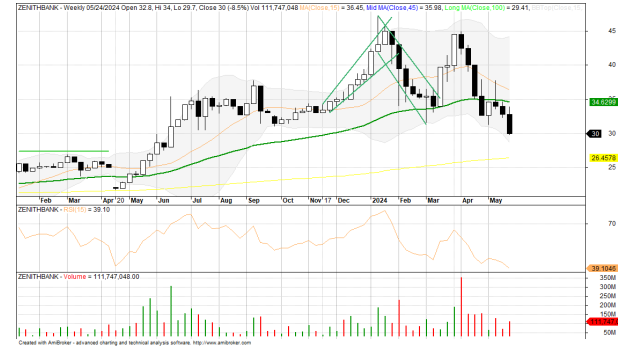
Zenith Bank Weekly Chart
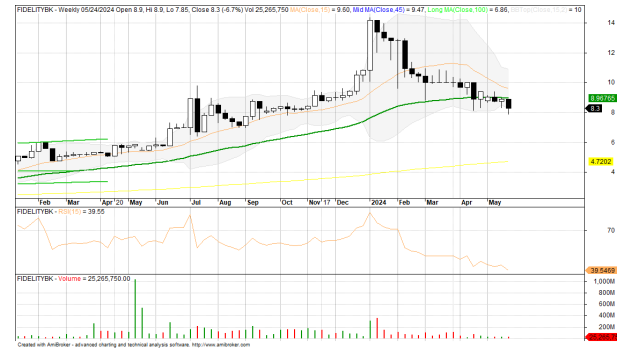
Fidelity Bank Weekly Chart
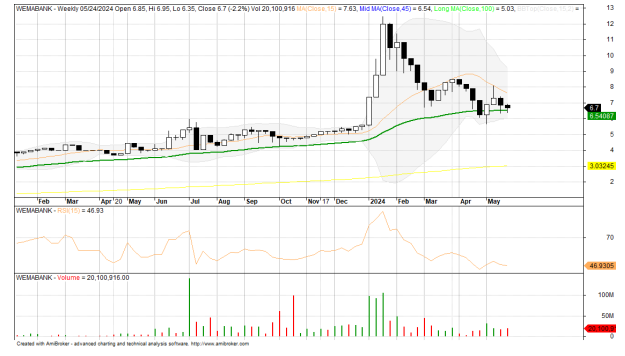
Wema Bank Weekly Chart
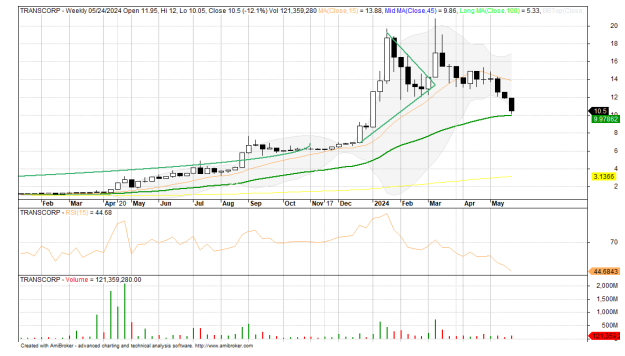
Transcorp Weekly Chart
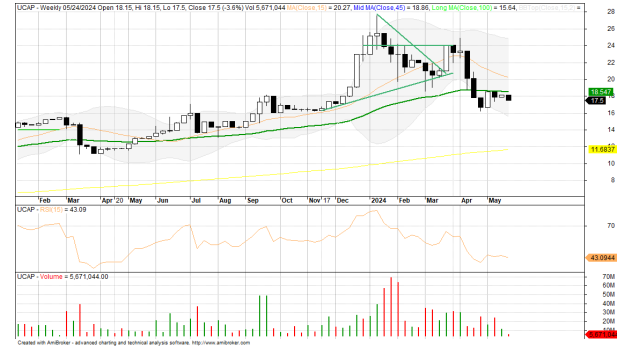
United Capital Weekly Chart
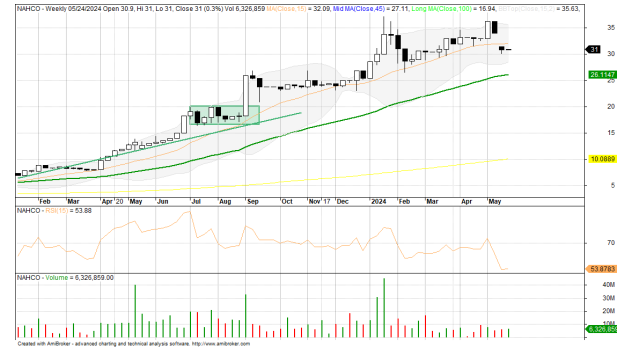
NAHCO Weekly Chart
Lafarge Africa Weekly Chart
