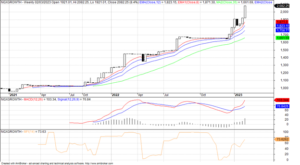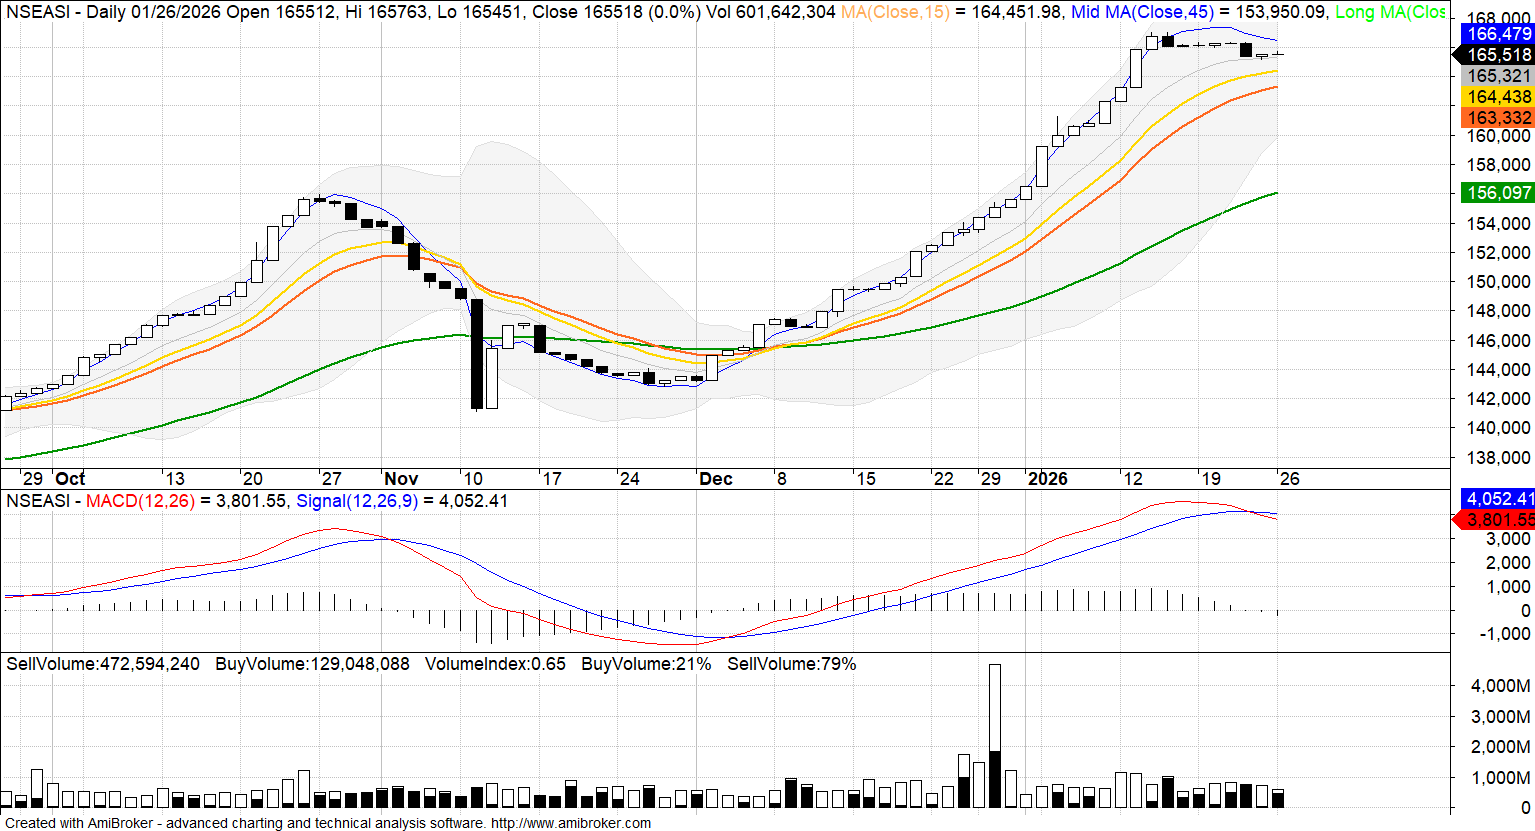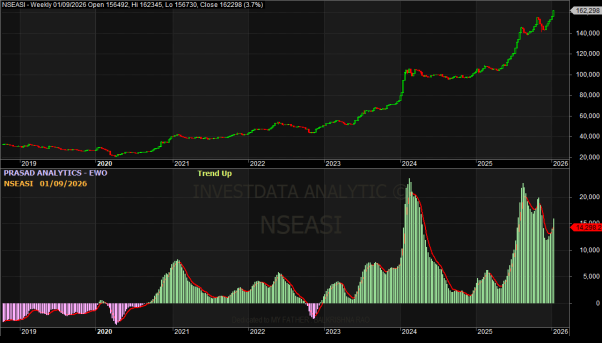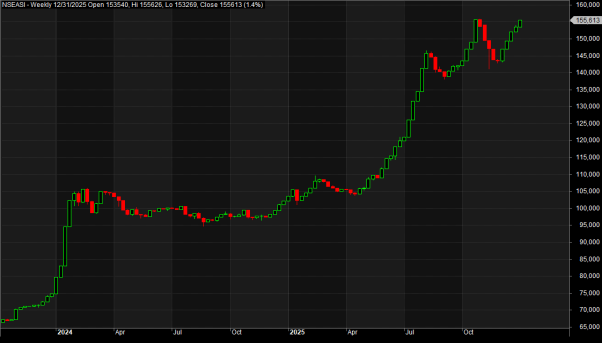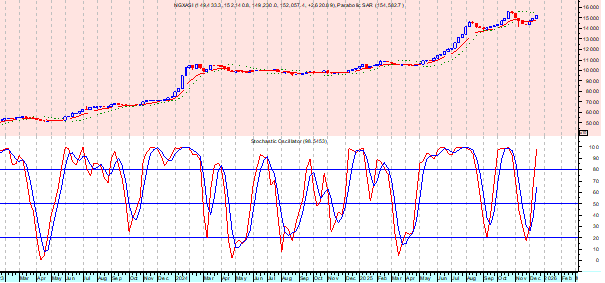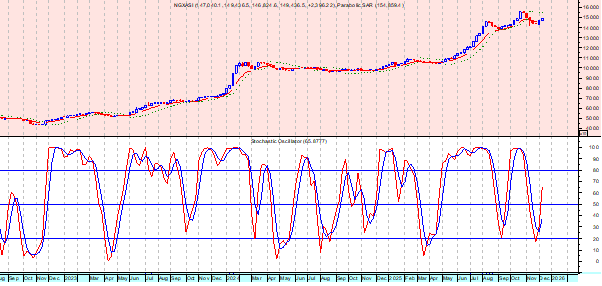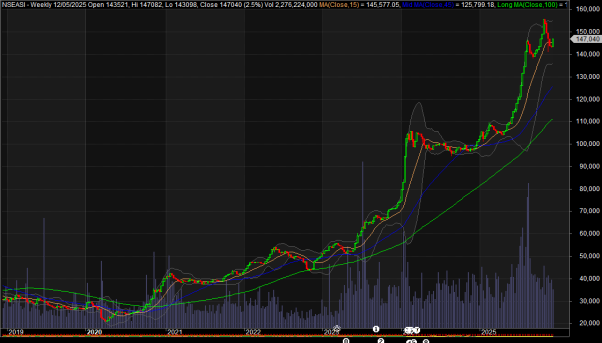
The NGX recovery is strengthening on the back of impressive corporate earnings to another level due to the increasing buying interests across major sectors of the market to trade at its 15-year high on strong momentum, which is relatively above its average trade volume and positive market breadth. This is happening in the face of changing yield environment and political uncertainties.
At the current phase of the market, it’s important that investors and traders understand how to read the charts to catch the rally and protect their investment if the market changes direction on profit taking, or price correction. Reversal, retest and continuation patterns are equal profits in trading, reversal pattern signal that buyers are aggressive and believe prices are low.
A retest of that reversal level confirms that demand is strong and buyers will be even more aggressive, similar reversal and retest patterns, when sellers are aggressive and believe prices are too high, this point is said to be the resistance and prices start to decline or correct,
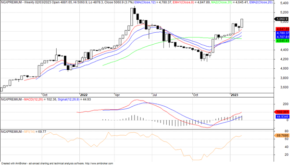
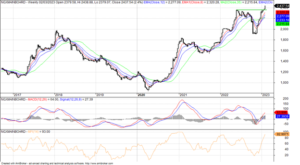
Technical analysis allows us to focus strictly on price actions to help put the odds our favour. As market players, we know that we only experience capital growth when the stocks we own increase in price. So, it is only logical to focus on the price chart using technical analysis to follow and trade in the direction of the general market and stocks we want to own. Below are the sectorial performance Charts to guide your investment decision
NGX BNK
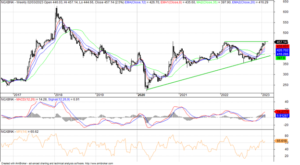
NGX Consumer Goods Index
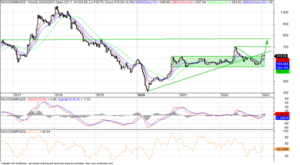
NGX Industrial Goods Index
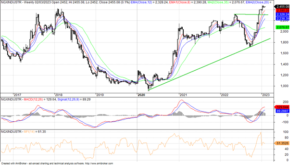
NGX INSU Index
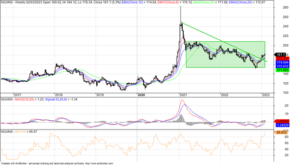
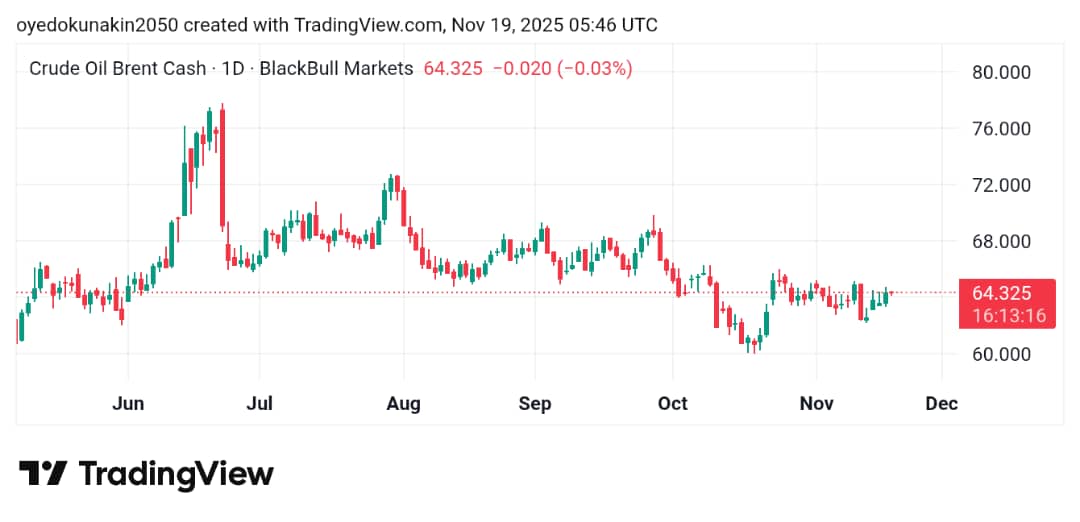
NGX Oil/Gas Index
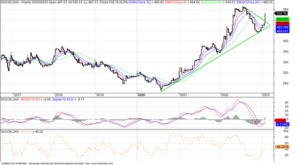
NGX 30
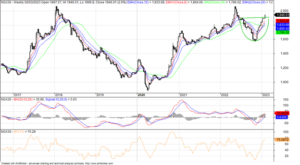
NGX PENSION
NGX 50
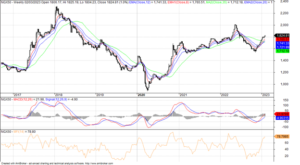
NGX PREUMUIN
NGX Main Board
NGX Growth Index
