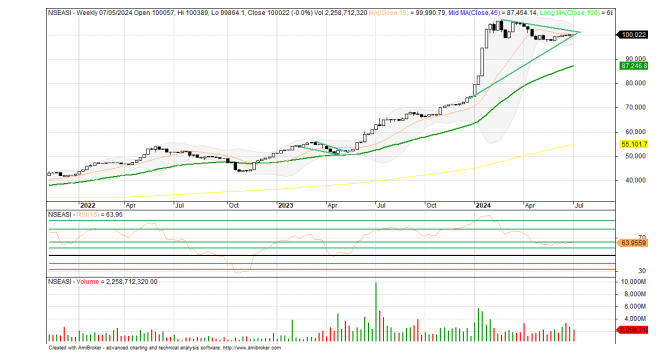
The Nigerian equity market is looking for direction as volatility continues on changing fundamentals and dynamics that calls for understanding of technicals that deals with prices, volume and psychology of market players. To master technical analysis and use it for spotting reversal, you must first understand market structure and interpretation of the candlestick for signal.
A small body at the top with a long lower shadow. This formation signals a bullish reversal when observed after a downtrend, particularly if the following candle closes above the hammer’s high. Combining this pattern with additional technical indicators improves its reliability. With these tactics, you are ready to capitalised on reversal opportunities. Understanding the context in which a hammer candlestick pattern appears is essential for accurately interpreting its implications for market reversals. You must conduct a thorough contextual analysis to gauge the reversal potential effectively. This involves evaluating the prevailing market environment and trend before committing to a trade based on hammer pattern.
First, assess the trend leading up to the hammer formation. A genuine hammer appears during a downtrend, signalling the potential exhaustion of selling pressure. However, you should not rely solely on the appearance of the hammer candlesticks, explore the trend evaluation to confirm the downtrend’s maturity and the likelihood of reversal. This includes analysing prior price action to understand the momentum and the strength of the preceding move. Next, consider the market environment, are there external factors that could influence price action? Its essential to integrate these elements into your analysis to avoid misinterpreting the hammer signal. Top sectors to buy now are revealed by the index and price actions below ahead of half year earnings reporting season.
NGXASI Weekly Chart (Opening chart)
NGX Banking Index Weekly Chart

NGX Oil/Gas Index Weekly Chart

NGX Insurance Index Weekly Chart

NGX Consumer Goods Index Weekly Chart

NGX Industrial Goods Index Weekly Chart

NGX 30 Index Weekly Chart

NAHCo Weekly Chart

Zenith Bank Weekly Chart

UBA Weekly Chart

GTCO Weekly Chart

FBNH Weekly Chart

Fidelity Bank Weekly Chart

Veritas Kapital Assurance Weekly Chart

Mansard Weekly Chart

Charms Weekly Chart

Eterna Weekly Chart


