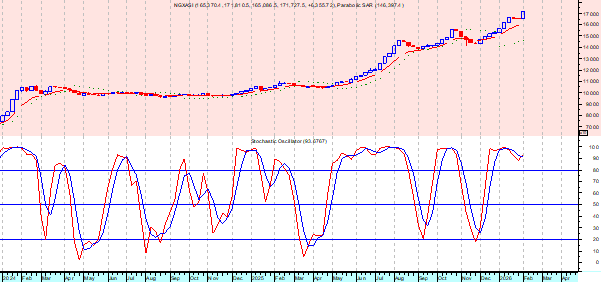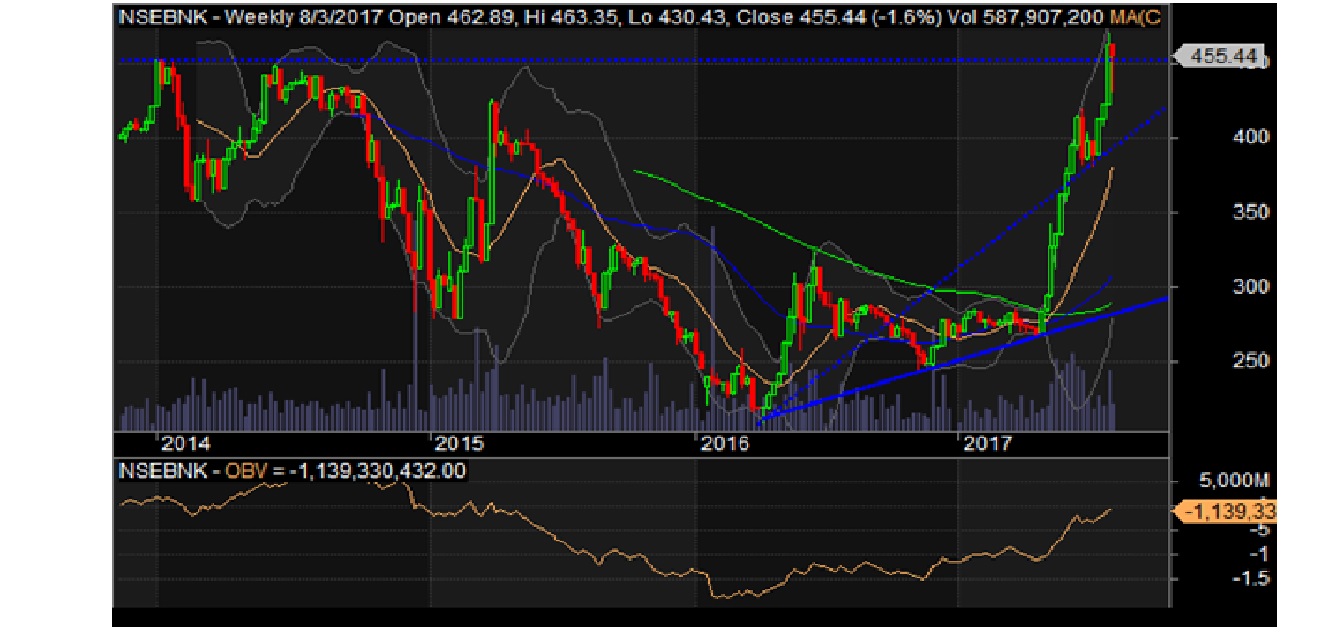
The bullish chart pattern of the Nigerian Stock Exchange (NSE) banking index suggests that the upside potentials of stocks in that sector is still high, despite the recent pullbacks on the strength of mixed performance in the financials released by some of the stocks.
In equities trading, a breakout of ascending triangle chart pattern supports future up trending, especially as first tier banks are expected to release their numbers and announce how much they are paying as interim dividend. Any major pullback or correction at this point will make the stocks much more attractive, meaning that any positioning now should be in stages in case of change in trending directional ability.
The sector’s volume traded index on a weekly and daily time frame were 0.80 and 0.94 respectively, while the weekly buying and selling position are 76% and 24% respectively and as at Thursday, buying volume was 97%, with selling position at 3%, an indications that investors and traders continue to be interested in the sectors.
On a daily time frame Money Flow Index is looking up at 82.32 to show that funds are entering the NSE’s banking sector, and at the same time RSI is reading 70.66 which is relatively in overbought region that will be influenced by market sentiment for the numbers expected. The trending ability is above 20 at 39.53 to support further uptrend.


