Company: OANDO PLC
Rating: Buy
Current Market Price at Earnings Release: N3.70
Intrinsic Value: N9.14
Equity Analyst: Tunde Segun Jeariogbe
Key Financial Tickers
• This report observed the half-year financial indices of OANDO Plc for the period ended 30th June 2019, compares the same with figures released in the similar period of 2018 to establish growth.
• A scan through the released numbers shows that the company is highly geared and currently running on a high Finance Cost that eats deep into its earnings.
• Safe for the income tax credit accounted for in the current period and in the comparable year, it would have reported negative half-year earnings. In fact, the Profit Before Tax for the two years compared in this report are negative.
• In the current quarter documents, the company reported N198.35 billion as long-term borrowings and N135.81 billion as short-term borrowings, which is same as N334.16 billion. Meanwhile, Total Equity for the period was estimated at N281.93 billion. In other words, the company used more debt than equity, increasing the risk of equity holders in the business.
• Gross Profit for the period stood at 41.88 billion, compared to the N51.02 billion in 2018 half-year financials. Please note that Finance Cost for the period is the same as 50.81% of the said Gross Profit.

Corporate Figures
• The Turnover figure released at the end of the quarter stood above the corresponding period by 6.09% and is currently valued at N315.40 billion, as against the N297.30 billion in the comparable quarter.
• Cost of Sales equally increased by 11.05% over the similar period at N273.52 billion, versus N246.29 billion last year.
• Operating profit dipped by 91.56% to N1.16 billion, as against N13.84 billion achieved at the end of 2018 half-year business session.
• Operating Expenses is currently estimated at N53.70 billion, same as 65.65% above the N32.41 billion stated in the comparable quarter of 2018.
• Finance Cost inched up by 1.35% to N21.28 billion, as against the previous N21.00 billion.
• Following the high Finance Cost, the management of Oando Plc reported a Loss before Tax of N17.28 billion, similarly, in 2018 half-year, it reported negative N2.26 billion.
• Nevertheless, taking succour from the Income Tax Credit worth N24.44 billion (2018-N10.755 billion), it achieved Profit after Tax of N7.16 billion, same as 15.60% below the N8.49 billion achieved at the end of 2018 half-year business session.

• Due to the reduced Inventories when compared to the similar period, Current Assets dropped against comparable year by 42.13% to stand at the current N114.56 billion, as against N197.96 billion.
• Non-Current Assets, on the other hand, was stable through the periods compared, as it is currently valued at N921.94 billion versus N918.65 billion.
• Current Liabilities fell by 5.51% to N440.47 billion, as against the preceding half-year’s N466.15 billion.
• Non-Current Liabilities dipped by 16.88% at N312.84 billion, as against N376.36 billion.
• Net Assets was equally stable as it only improved by 2.87% to stand at N281.97 billion from N274.09 billion last year.
• Presently, the Retained Loss for Oando adjusted down by 10.76% from the previously reported N137.74 billion to N122.92 billion.
Liquidity/Risk Ratios
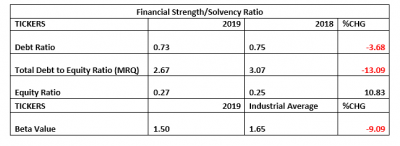
• Debt Ratio, a ratio comparing the Total Liabilities of the company to its Assets, is currently estimated at 0.73x, implying that the Assets Valuation is 27% as the Company Liabilities.
• As noted above, the company is currently highly geared, the Total Liabilities is estimated to replicate the Equity in 2.67x, although this is better than 3.07x estimate of the previous half-year.
• Equity Ratio is currently valued at 0.27x as against 0.25x last year, which confirms that equity is 25% of the total assets.
• Please understand that the above Equity Ratio is lower than the 0.73x Debt ratio calculated above. This is an indication that the equity holder’s position in Oando Plc’s business is at very high risk.
• Nevertheless, the share price of Oando had confirmed good patronage from the investing public as it has a Beta value above the market.

Profitability Ratios
• EBITDA Margin is currently estimated at 0.37%, same as 92.04% below the 4.66% achieved in 2018 half-year.
• Pre-Tax Margin fell to -5.48%.
• Cost of Sales to Total Assets was relatively stable through the period and is currently estimated at 86.72%, compared to the previous 82.84%.
• Return on Equity is estimated at 2.54% versus 3.10% in 2018.
• See below for details

Efficiency Ratios
• Management efficiency in managing Operating Expenses improved by 56.14% when we tested the Opex to Revenue. The Ratio grew to 17.03% from the previously estimated 10.90%.
• Total Revenue to Total Assets is estimated at 30.43%, which is a 14.29% improvement in efficiency when compared to the 26.63% achieved last year.
• Working Capital Turnover of Oando was negative within the two periods observed, which means that the liabilities that need to be paid within one year exceed the current assets that are monetizable over the same period. Unlike the previous year when the Working Capital Ratio was above unity, despite being negative, the ratio is currently below one, and this is an indication that there will liquidity problem in the future
• Working Capital Ratio, which is a measure of liquidity and reveals whether a business can pay down its obligations, stood below unity and even stood at 0.26x. This is further confirmation that there might be a liquidity problem in the future.
• Academically, the followings could be considered in an attempt to correct the two defective ratios stated above: Incentivize Receivables, Meet Debt Obligations, Choose Vendors Who Offer Discounts, Analyze Fixed and Variable Costs, Examine Interest Payments, Manage Inventory, Automate Accounts Receivable and Payment Monitoring, Resolve Disputes with Customers and Vendors.

Investment Ratios
• The amount earned per unit of Oando at the end of the period dipped by 15.60% to stand at the current estimate of N0.58, as against the previous N0.68.
• Total Comprehensive Income equally dipped to N0.39 from N1.16.
• P/E-Ratio adjusted down to 6.42x from the previous 7.10x. The difference between the ratios was due to investors revaluation of the share price of Oando on the floor of the exchange within the two periods considered
• The said earnings is a yield of 15.59% which is a 10.64% improvement from the previously estimated 14.09% yield.
• Presently, Oando’s Book Value is largely below our fair value and the market value as it is currently estimated at N22.68, up from the previous estimate of N22.05 each.
• Further confirming the underpriced stand of the company is the Price to Book Value of 0.16x, standing below unity in both periods considered.

Valuation
• Since Oando has not paid a dividend in a long while, especially when its negative retained earnings state is put into consideration, we opted for a valuation model observing only its books. In this regard, the Free Cash Flow for Equity method was explored. Thus, we arrived at a fair value of N9.14, since this is well above the current market price of Oando, we Rated the stock a Buy.


