
Rating: BUY
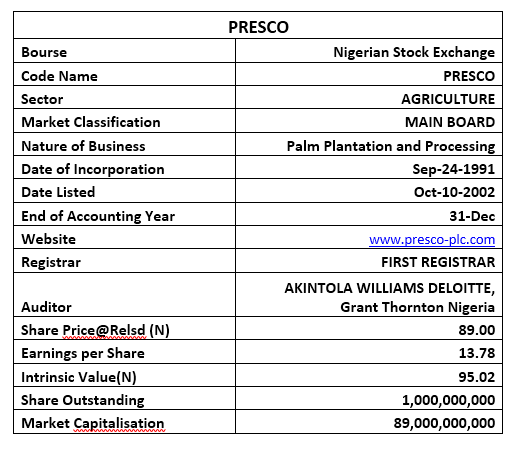
Current Market Price: N89.00
Year High: N89.00
Year Low: N68.00
Fair Value: N95.02
Equity Analyst: Tunde Segun Jeariogbe
Key Investment Ratios
- This report relates to the third quarter financial records of Presco Plc for the period ended 30th September, 2021, compares same with the similar result released in 2020 to establish growth, and valuation where necessary.
- Generally, the performance for the quarter was very outstanding, especially when compared to the comparable period in 2021.
- It is necessary to note that the valuation of Presco share price is mainly affected by the near-to-zero growth rate in dividend payout in the past. Nevertheless, given the recent developments in dividend payout, we are confident that the valuation will look better after the full-year numbers are made available to investors.
- In other words, the current valuation is strictly based on past full-year performances.
- see below for a detailed analysis of the recently released third-quarter numbers.
Company figures
- Turnover for the nine months stood at N34.23 billion, the same as 80.94% above the turnover in the similar period of 2020
- Cost of Sales equally grew above the comparable quarter by 53.03% to stand at N10.71 billion against N6.99 billion in the corresponding quarter
- Operating Profit for the nine months soared against the comparable period by 132.47% at the current estimate of N18.12 billion against N7.79 billion
- Operating Expenses grew above comparable period’s by 49.36% to stand at N5.28 billion against the previous N3.53 billion
- Finance Cost through the first nine months of 2021 is valued at N545.08 million, this is 55.32% below the N1.22 billion reported at the end of the 2020 nine months business cycle
- Profit before Tax soared above the comparable period by 167.31% at the current estimate of N17.58 billion against N6.55 billion in 2020
- Having accommodated the Tax Expenses over the period, the board of Presco reported N13.77 billion as profit for the period, against N5.03 in the comparable period.
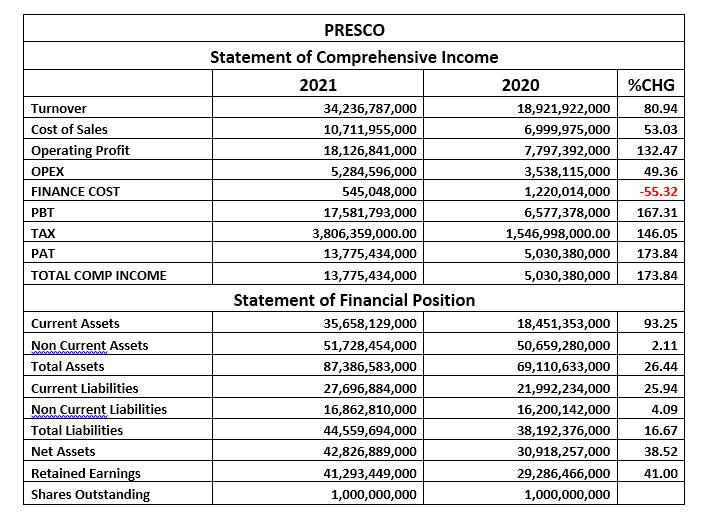
- Current Asset was valued at N35.68 billion, as against N18.45 billion at the end of 2020 nine months. The difference between the two valuations is the same at 93.25%.
- Similarly, Non-Current Assets is valued at N51.72 billion, a marginal 2.11% improvement over the N50.65 billion quoted in its 2020 third-quarter financials.
- Meanwhile, Current Liabilities grew by 25.94% to N27.69 billion as against the previously reported N21.99 billion in 2020.
- In the same trend, Non-Current Liabilities grew marginally above the similar nine months of 2020 by 4.09% to N16.86 billion, compared to N16.20 billion.
- Net Assets is therefore estimated at N42.82 billion, the same as 38.52% above the previous value of N30.91 billion.
- Also, Retained Earnings appreciated by 41.00% to N41.29 billion, versus the N29.28 billion in 2020.
Financial Strength/Solvency Ratios
- The Debt Ratio is currently estimated at 50.99%, the same as 7.73% below the 55.26% estimated from the similar period’s number.
- Total Debt to Equity was equally estimated at 104.05%, versus the 123.53% achieved in the corresponding quarter of 2020. This simply implies that more debt was used to service the company’s assets through the period.
- It was established that Equity is the same as 49.01% of Presco’s Assets Value, representing a marginal drop from the 44.74% ratio in 2020 third quarter.
- Going by the far below unity beta value (0.45), we can safely conclude that Presco is relatively not a liquid stock.

Profitability Ratios
- Operating Profit is estimated at 52.95% of the Turnover, as against the 41.21% achieved of 2020 third quarter.
- Profit before Tax is 51.35% of the reported Turnover, which is 47.73% higher than the 34.76% estimated from the corresponding period.
- Cost of Sales was 31.29% of the Turnover, 15.42% below the 36.99% estimated in 2020.
- Return on Equity stood at 32.17% against 16.27% of 2020 third-quarter business session,

Efficiency Ratios
- Operating Expenses to Turnover value is the same as 15.44%, this is a 17.45% improvement in efficiency from the 18.70% estimated from 2020 third-quarter financial indices.
- Turnover to Total Assets Ratios stood at 39.18%, against 27.38% estimated from 2020 third-quarter numbers. This implies a better utilization of the company’s assets through the period
- See below for other efficiency ratios.

Investment/Valuation Ratios
- At the end of the quarter, the company earned N13.78 on every share listed on the Nigerian Exchange, representing a juicy 173.84% growth when compared to the N5.03 earned at the end of 2020 third-quarter business session.
- Going by our adjusted P/E-Ratio for nine months, the price of each unit of Presco Plc as of the time this report was presented to the investing public replicated the EPS 6.46 times, that is, the P/E-Ratio is 6.46x as against 9.43x.
- The said earnings per share represents a 15.48% yield of the current market price of Presco as of release date, which is higher than the 10.60% yield achieved in 2020.
- Book Value per share shows an over-valued position at N42.83, against the previous estimate of N30.92 each. We ascribe the wide gap in the value to investor sentiments for Presco shares.
- Further confirming this position is the Price to Book value at above unity in the two periods compared in this report.

Valuation
`Our valuation for Presco stood far below investor’s valuation on the floor of the exchange. As noted above, we are of the opinion that the valuation may look up at the end of the current financial year. We have fairly valued each unit of Presco Plc shares at N95.02, and have Rated it a BUY.


