Quarter Under Preview: Third Year
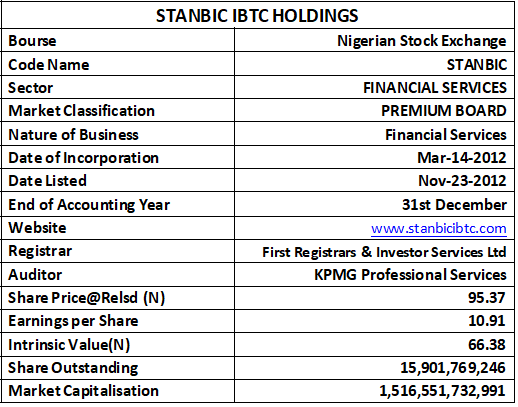
Current Share Price: N118
Price At Released: N95.37
Latest Final Dividend: N3.00
Latest Interim Dividend: N2.50
Estimated Beta Value: 0.35x
Estimated Intrinsic Value: N66.38
Jeariogbe Tunde Segun
The Bank
Stanbic IBTC Holdings Plc is a financial holding company. The company, the Nigerian subsidiary of South Africa’s Standard Bank Group, is primarily involved in the provision of banking and other financial services to corporate and individual customers. Its segments include Business & Commercial Banking (BCB), Corporate and Investment Banking (CIB), Personal and Private Banking (PPB) and Insurance and Assets Management (IAM). The BCB segment provides residential accommodation financing, and vehicle and asset financing solutions.
The CIB segment offers trading and risk management solutions across financial markets, cash management, international trade finance, working capital and investor services solutions, among others. The PPB segment offers credit card, lending products, and a suite of transactional, savings, payment and liquidity management solutions.
Financials
At the end of the six-month operating period, the management of Stanbic IBTC reported a Gross Earnings income of N516 billion, 36.48% above the N378 billion reported at the end of the first half of 2024. Interest Income component of that amount is estimated at N384 billion, against N246 billion in the corresponding quarter. Interest Expenses stood at N68 billion versus N71 billion. Operating Expenses grew by 37.86% to stand at N179 billion from the N129 billion used through the corresponding period of last year. In all, Total Profit reported for the session is N173.43 billion, higher than the N116.35 billion in the corresponding period. Kindly see the below table for details:
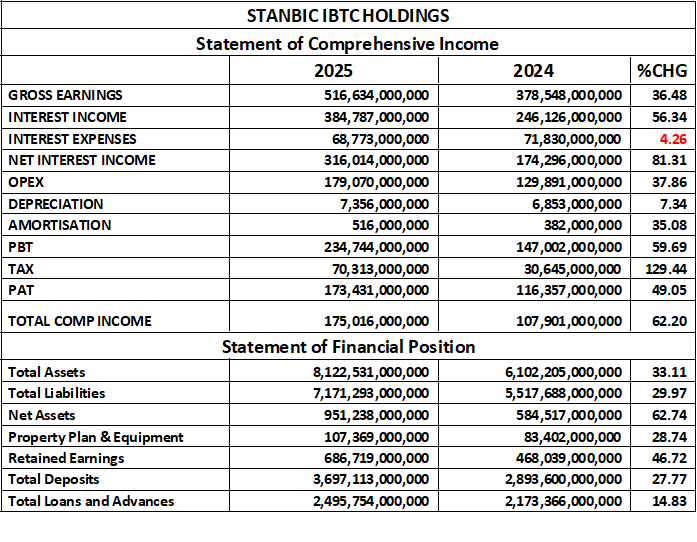
Total Assets of Stanbic IBTC is valued at N8.122 trillion at the end of the quarter, 62.20% higher than the N6.102 trillion valued at the end of last financial year. Total Liabilities estimate stood at N7.171 trillion versus N5.517 trillion in the corresponding quarter. Thus, Net Assets is estimated at N951.238 billion, versus N584.517 billion, while Retained Earnings grew by 46.72% to N686.719 billion from N468.039 billion. Total Deposits received through the six months is estimated at N3.697 trillion versus N2.893 trillion, while Total Loans and Advances estimate is N2.495 trillion as against N2.173 trillion. See the table above for details:
Financial Strength
Debt Ratio reduction from 90.42% to 88.29% indicates a mild improvement in financial stability. The bank is relying slightly less on borrowed funds for its operations. This is a positive sign, given that lower debt means improved capital structure and reduced financial risk. However, for banks, high debt ratios are normal, because deposits are classified as liabilities. So, this decline shows better internal funding or capital retention.

Total Debt to Equity Ratio is estimated at 7.54x versus 9.44x, meaning that the financial institution has N7.54 debt for every N1 equity, down from N9.44. This also implies a reduced leverage and stronger equity backing. The bank has strengthened its capital base relative to borrowed funds. It may be retaining more earnings or has raised equity capital, reducing dependence on liabilities. For banks, a range of 6x-10x is common, so Stanbic remains within normal industry tolerance level, but on the safer end.
Equity Ratio also showed a strong improvement. A higher equity ratio indicates greater capacity to absorb losses and meet regulatory capital requirements (e.g Base III, CCBN guidelines). This trend enhances the bank’s financial resilience and investor confidence.
In summary, Stanbic IBTC shows a solid improvement in balance sheet strength- lower leverage and higher equity base. This trend signals effective risk management, capital retention, and strategic de-risking.
Profitability Ratios
EBITDA margin rose from 56.05% to 76.30% showing better cost control, higher efficiency or improved income mix. This may reflect growth in non-interest income and tight cost management during inflationary pressure. Pre-Tax Margin shows the share of revenue that remains after all expenses but before tax. The movement of the ratio from 38.83% to 45.44% shows that Stanbic IBTC is earning more per naira of revenue before tax. This indicates strong revenue growth, improved cost efficiency, and possibly better loan book performance. (Lower impairment)

Interest Expense versus Gross Earnings moved from 13.31% to 18.98%. The drop means a lower cost of funds that is: the bank is paying less interest relative to income, and suggests an improved deposit mix (more current and savings accounts versus fixed deposits), or effective treasury management. ROAE dropped from 19.91% to 18.23% meaning equity is earning slightly less. Despite improved margins, the drop could result from higher retained earnings, or capital base. (Since equity increased), which reduces the ratio mathematically.
ROAA grew from 1.91% to 2.14%, this reflects better utilization of assets and improved profit from the balance sheet. In our opinion, based on the Profitability Ratios, Stanbic IBTC is in a very healthy profitability position. Efficient, well-capitalized and generating strong earnings quality.
Efficiency Ratio
Operating Expenses to Gross Earnings Ratio rose slightly from 34.31% to 34.66%, meaning that cost grew almost in proportion to revenue. And since the difference is minimal, we can say the overall efficiency remains stable. In our opinion, even in inflationary pressures maintaining OPEX near 35% is commendable. It implies good cost discipline and efficient operations, especially impressive if revenue and headcount grew.

Gross Earnings to Total Assets ratio inched from 6.20% to 6.36% indicating more efficient deployment of assets, better interest earning portfolio, stronger loan book performance, and effective asset mix management. Loan to Deposit Ratio equally moved from 75.11% to 67.51%, ab indication of how much of customers’ deposit are converted into loans and advances. The decline means the bank is lending out a smaller portion of its deposits. In our opinion possible reasons are: a cautious lending stance amid economic uncertainties, and diversification into low-risk or non-loan income source.
In conclusion, Stanbic IBTC is operating with efficient cost management, productive assets, and a conservative risk posture- this is a hallmark of well-managed, stable and sustainable bank.
Investment Ratios
At the end of the six-month business session, the estimated Earnings Per Share EPS stood at N10.91 from N8.98 in the previous session, indicating higher earnings generation, improved cost efficiency, and possibly stronger interest and non-interest income. Consistent EPS growth boosts investor confidence and supports dividend sustainability. It shows Stanbic’s business model is performing strongly despite macroeconomic pressures. PE/Ratio rose from 1.64x to 2.19x implying market optimism; investors are now valuing Stanbic future earnings more positively. However, a P/E-ratio of 2.19x remains very low compared to both the Nigerian banking industry average and international benchmark.

Earnings Yield declined slightly from 15.23% to 11.44% because of the rise in PE/Ratio rose. This does not mean earnings dropped (they actually increased) rather, the share price rose faster than earnings, reducing the yield percentage. Book Value Per Share is not valued at N59.82 from the previous estimate of N45.11 this shows strong retained earnings and asset base growth. It indicates that Stanbic has been reinvesting profits effectively to grow shareholders’ equity.

Conclusion
Stanbic IBTC shows a solid and improving financial profile across all key metrics. Thus, we conclude that Stanbic is fundamentally strong, efficiently managed, and well capitalized. A reliable choice for medium, to long-term investors seeking stable dividend income and capital appreciation.


