Coy: Sterling Bank Plc (STERLNBANK)
Rating: Hold
Current Market Price: N2.45
NPL RATIO (Q1-2019): 8.91%
Year High: N2.74
Year Low: N1.86
Fair Value: N3.80
Equity Analyst: Tunde Segun Jeariogbe
Introduction
• This report observed the financial performance statistics of Sterling Bank Plc for the first three months of 2019, compared with similar financials for the corresponding period of 2018 to establish growth trend.
• We also observed a few valuation metrics from its performance indices for the year ended December 31, 2019.
• From the last quarter of 2018, the company’s Retained Earnings swerved into negative territory at -N552 million.
• We have therefore rated the result low quality, given that the few restated figures differ largely from the original results presented to investors initially. For example, the company’s Total Comprehensive Income reported for the 2018 first quarter was N4.02 billion, before it was restated as N11.85 billion in 2019 first quarter results.
• In our opinion, such a huge difference significantly lowers the reliability of the numbers, hence, result quality is rated poor.
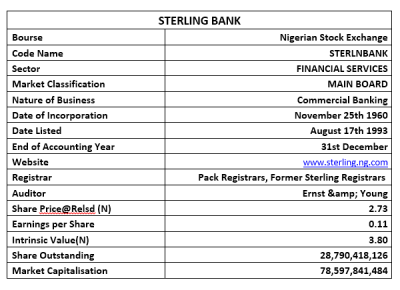
Company figures
• Gross Earnings for the quarter was estimated at N36.49 billion, this is 8.24% below the N39.76 billion posted at the end of 2018 first quarter.
• Interest Income stood at N30.79 billion as against the N31.08 billion of 2018.
• Interest Expenses, on the other hand, dipped by 18.30% to stand at N15.862 billion, compared to the previous N19.415 billion.
• Net Interest Income inched up 3.61% to N19.78 billion as against N19.09 billion.
• Operating Expenses stood at N15.08 billion, 3.90% above the previously reported N14.52 billion.
• Profit before Tax is currently estimated at N3.27 billion, rising by a marginal 3.09% over the N3.17 billion achieved in 2018 first quarter.
• Having considered the N33.00 million Tax Expenses, estimated profit for the year stood at N3.24 billion, slightly above the N3.10 billion posted at the end of 2018 first quarter business cycle.
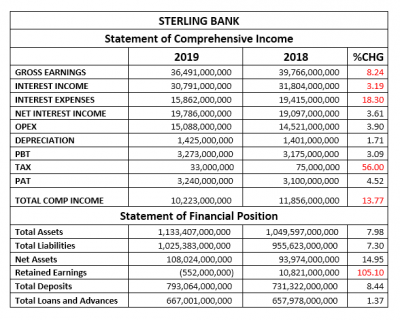
• Total Assets valuation improved by a marginal 7.98% to N1.13 trillion, compared to the N1.04 trillion reported at the end of operations for the 2018 first quarter.
• Similarly, Total Liabilities grew by 7.30% to N1.02 trillion, up from the N955.62 billion reported in 2018.
• Net Assets improved to N108.02 billion, compared to N93.94 billion in 2018, the difference between both figures is the same as a drop of 14.94%.
• As stated earlier, Retained Earnings dropped from N10.82 billion in the 2018 first quarter to a negative N552.00 million at the end of 2019 first quarter.
• Total Deposits achieved through the first three months of 2019 inched slightly by 8.44% to N793.06 billion compared to N731.32 billion in 2018 first quarter.
• Total Loans and Advances crawled 1.37% to N667.00 billion from N657.97 billion.
Financial Strength/Solvency Ratios
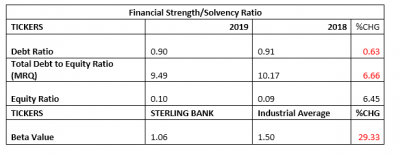
• Debt Ratio which compared both Total Assets to Total Liabilities stood at 0.9x or 90%, implying that the Total Liabilities is 90% of Total Assets. Note that Total Liabilities is inclusive of Total Deposits for the period.
• Total Debt to Equity for the quarter stood at 9.49x, same as 6.66% below the 10.17x estimated in 2018. This implies that the company used Debt equivalent to 9.49 times of its equity through the period (note debt used is total liabilities and is inclusive of total deposits for the period).
• Equity Ratio which compared Equity to Total Assets stood at 0.10x as against 0.09x, implying that the reported Equity at the end of the period is 10% of Sterling Bank’s Total Assets.
• Estimated Beta value of Sterling Bank as at the time this report was compiled stood at 1.06, which is above market Beta, although below the industry average.
Profitability Ratios
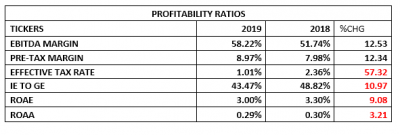
• EBITDA margin estimated for the period stood at 58.22%, 12.53% above the 51.74% estimated numbers from the corresponding quarter.
• Pre-Tax Margin improved by 12.34% to 8.97% against the 7.98% estimated at the end of 2018 first quarter.
• Interest Expenses to Gross Earnings dipped by 10.97% to 43.47% against the previously estimated 48.82%.
• Return on Average Equity through the first three months of 2019 was 3.00%, compared to 3.30% in 2018
• See the table below for detailed profitability ratios and comparison.
Efficiency Ratios
• Operating Expenses figure posted at the end of the period is estimated to be 41.35% of the Gross Earning, which is higher than the 36.52% achieved in 2018 first quarter financials. Also, note that this implies an increased rate of expenses.
• Gross Earnings estimated from the financials is same as 3.22% of the Total Assets value posted for the period under analysis
• Total Loan and Advances posted for the quarter is 84.10% of Total Deposit, this is lower when compared to the 89.97% estimate of the 2018 first quarter. Nevertheless, in our opinion, this is on the high side.

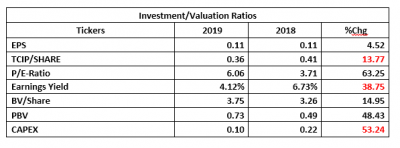
Investment/Valuation Ratios
• The profit earned per unit of Sterling Bank is estimated at N0.11, approximately the same as comparable period.
• Total Comprehensive Income is estimated at N0.36, which is 13.77% below the N0.41 TCI/share achieved in 2018.
• P/E-Ratio grew to 6.06x from 3.71x, implying improved investor sentiments for the shares of Sterling Bank.
• The said earnings per share is a yield of 4.12% of the price of each unit of Sterling Bank on the NSE when the result was unveiled to the investors.
• The estimated value of each unit of Sterling Bank in its book is N3.75, this is 14.95% improvement over the previous estimate of N3.26.
• Confirming the academic under-priced stance of Sterling Bank shares on the floor of the exchange is the Price to Book Value estimate at below unity.
Valuation
While attempting to rightly value Sterling Bank’s Shares on the floor of the exchange, we got more comfortable with the Free Cash Flow to Equity (FCFE) valuation approach. Thus, working mainly with metrics from the full year performance indices, we placed the shares at N3.80, and thus rated it as Hold.


