This week is the last in the third quarter of 2017 and would offer a deeper insight into what should be expected from companies in different sector of the economy at year-end.
Therefore, take a look at the sectorial indexes chart below to know where to buy against the quarter end and indeed the last quarter of the year, considering market performance and economic recovery so far. Knowing that the market has gone ahead of the economy because it came out of a three-year recession before the economy due to positive sentiment that followed full-year 2016 and first half of 2017 earnings season that beat market estimates and expectations. This is in addition to the apex bank’s intervention in the foreign exchange market that attracted more inflow and liquidity into the market.
This week, we are looking at the weekly index action in major sectors of the market, given that the recently released positive economic data did not impact the market as sentiment remained mixed.
That notwithstanding, the weekly technicals appear stronger to support the recovery but is still trading below the yellow downtrend line. There was an increase in the volume and price movers in the week under review, with market volume index of 0.72 and buying position of 100%, and 0% selling volume for the week’s transaction to halt the previous week’s down market.
Activities last week show that some sectors had broken down support but with attempt to rebound, just as volume breakout was also strong, coming above or below its 20 and 50-day moving average.
From a technical perspective, market reversal is imminent in the short run; just buy to ride the trend with good understanding of resistant and support to know when to sell for profit and when to buy at low.
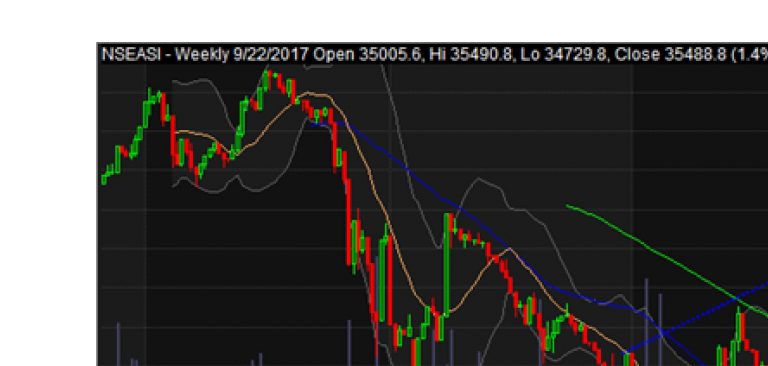
NSEASI WEEKLY TIME FRAME
The NSE ASI on a weekly time frame has sustained its down-trending, but signals imminent rebound on positive sentiments despite still trading below the downtrend line. The index breakout of the downtrend line on daily time frame is as a result of increased momentum from traders and investors repositioning for quarter end rally and Q3 numbers ahead.
The recent correction of the index remained strong but the trending ability of the market on weekly and daily time frame is strong with ADX above 20 for the period at 45.46 and 21.20 respectively.
Traders should watch out for a breakout of the yellow downtrend line as more speculators return to trade the quarter end and Q3 earnings season, while trading with caution ahead of the two-day Monetary Policy Committee (MPC) meeting that opens today. Watch out for the first resistance level at 35,756.80 and the second at 36,095.12 point, and any move down to 35,188.07 and 34,856.34 respectively.
Looking at technical indicators, the NSEASI closed below the upper band by 35.8%, while MACD is a day bearish, just as the RSI is reading 62.67 relatively on overbought region. Money flow index on a weekly time frame is turning up, while daily, it is looking up to indicate that funds are entering the market. The momentum indicators like RSI, CCI, MACD and SO are signaling SELL. Despite the weak market as a result of ongoing correction, the NSE’s composite index is still trading above it 20 and 50 day moving average.
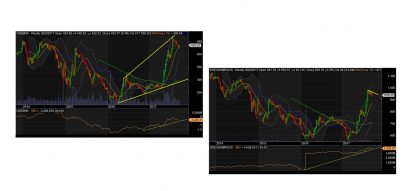
NSE Banking Index

As you can see, the banking index is trading above its 20 and 50-day moving average with strong positive market sentiments for the industry as the sector’s volume index of 0.73 with buying position of 96%, and 4% selling volume for the week’s transaction to halt the previous week southward move. As the sector recorded more green days than red to close the period under review higher. Despite the negative news that four Nigerian banks are operating below minimum capital required, due to high exposure and Non-Performing Loans (NPL). The sector’s trending ability on a weekly time frame is strong since ADX is above 20 at 47.08, while on daily time frame is weak with ADX below 20 at 16.92 as at Friday.
Traders should position in stages in this sector or wait for the outcome of the meeting of the Central Bank of Nigeria’s (CBN) MPC to know the health status of the nation’s banks, especially the second tier operators that is likely to send panic to the market if not handled well by the apex bank. Despite the expected return of speculators to trade the quarter end and Q3 earnings season ahead. The first resistance level is at 439.69 and the second at 445 point, any move down to 435.43 and 424.77 respectively.
Looking at technical indicators, the NSE BNK index closed below the upper band by 34.4%, while MACD is bearish. RSI is reading 66.01 relatively on overbought region. Money flow index on a weekly time frame is turning up, while daily, it is looking up to indicate that funds are entering the market. The momentum indicators like RSI, CCI and MACD are signaling SELL, while SO is saying buy
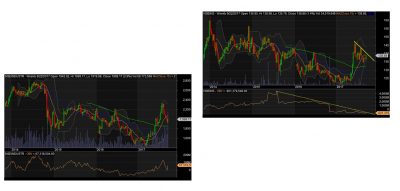
NSE Consumer Goods Index
NSE Consumer Goods index is currently experiencing a divergence as OBV is trending while the index action is moving down to close the week lower. A breakdown of the dotted yellow lines will confirm a major pullback in the short term. The index still remain relatively strong as it is trading above the 20 to 50 day moving average as at last week Friday. The sector’s volume index of 0.61 with buying position of 57%, and 43% selling volume for the week’s transaction to continue a two-week downtrend as a result of profit booking from the industry’s recent rally due to the improving earnings recorded by the sector in Q1 and Q2 which is likely to continue in the expected third quarter results to reverse this downtrend.
Traders should watch out for support levels of equities in this sector and on this pulled backs as reversal is imminent. The first resistance level is at 956.12 and the second at 966.77 point, any move down to 934.56 and 921.22 respectively.
The NSE’s Consumer Goods index trending ability on weekly and daily time frame is strong since ADX trading above 20 at 50.88 and 28.53 respectively. Looking at technical indicators, the NSECONSGOODS closed below the upper band by 24.4%. MACD is bullish, while RSI is reading 67.20 almost at overbought region. The momentum indicators like RSI, SO and CCO are signaling sell, while MACD signaled buy.

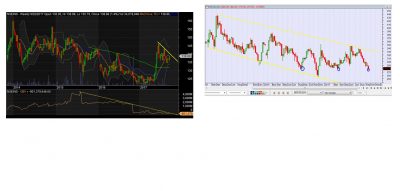
NSE Industrial Index
NSE Industrial Goods index had suffered five straight weeks of decline after forming a double top on August 11. The sector is currently trading below its 20-day moving average but above the 50 DMA as revealed on the chart. Trending ability of the industry on weekly and daily time frame are strong as ADX is above 20 at 35.40 and 27.43 respectively to support this rebound that signal buy opportunity in some of the stocks in the sector.
Its volume index of 3.74 with strong buying pressure of 100% while 0% selling volume for the week’s transaction to trigger period reversal as earlier pullback had created new entry point for traders ahead of Q3 end window dressing and October earnings season. Looking at technical indicators, the NSEINDUSTR closed below the upper band by 49.7%., while MACD is bearish for two trading days. RSI is reading 53.50 relatively on overbought region. Money flow index on a weekly time frame is turning down while on daily time frame, it is looking up to indicate that funds are entering the market. The momentum indicators like RSI, CCI, SO and MACD are signaling SELL.
NSE Insurance Index
NSE Insurance index is still trading below the downtrend line despite it rebounded last week to close higher. The weekly chart reveals the sector index is below the 20-day moving average as at the end of last week, but strength is returning in form of improving volume and with the prices of some stocks in the sector hitting 52weeks high. The sector’s volume index stood at 0.36, buying position of 97%, and 3% selling volume for the week’s transaction to halt the previous week’s southward movement.
Traders should wait for breakout of the yellow line on the sector index and volume to confirm strength of rallying before jumping into the stocks in the industry. The first resistance level is at 140.77 and the second at 143.12 point, any move down to 135.76 and 134.41 respectively.
The sector’s index trending ability on a weekly time frame is strong since ADX trading above 20 at 24.77 and weak on daily time frame as ADX is below 20 at 14.33. Looking at technical indicators, NSEINS closed below the upper band at 42.7%. MACD is bearish, while RSI is reading 56.61 relatively strong. The momentum indicators like SO, MACD and CCO are signaling sell, while RSI signaled buy.

NSE Oil/Gas Index
NSE Oil/Gas Index has been trending down for the last two years, despite various attempts at rebound, but recently formed a triple bottom that supported reversal of trend, if the current pullback again becomes an attractive entry point. This suggests that stage positioning in the stocks in the sector that had suffer decline as a result of general market direction, not due to fundamental disintegration of individual stocks. The sector is currently trading below its 20 and 50-day moving average to indicate weakness.
Trending ability of the sector on a weekly time frame is weak as ADX is below 20 at 15.06, but strong on a daily time frame as trading above ADX at 44.09. Volume index for the sector stood at 0.45 with buying position at 0.32% while selling volume is at 0.68% of the week total transaction to reveal selling pressure that had kept sector in the south direction.
Traders should wait for reversal before jumping into any position in the industry. Looking at technical indicators, NSEOILGAS closed above the lower band by 0.3%. MACD has been bearish in the last five trading session, while RSI is reading 38.01 relatively at oversold region. The momentum indicators like SO, MACD and CCO are signaling sell, while RSI signaled buy.


