Traders Watch 31
The nation’s equity market so far in the 2017 has maintained an up and down trading pattern on daily and weekly basis to reflect the confidence level of traders and investors in the economy and the financial markets.
This has been variously linked to a mix of the January effects, in addition to portfolio rebalancing by fund managers and other market players, which are besides the intermittent profit booking activities. Despite the earnings season that is around the corner, the market awaits the outcome of the two-day meeting of the Central Bank of Nigeria’s Monetary Policy Committee (MPC) which begins on Monday to give direction of flow of funds in the financial market.
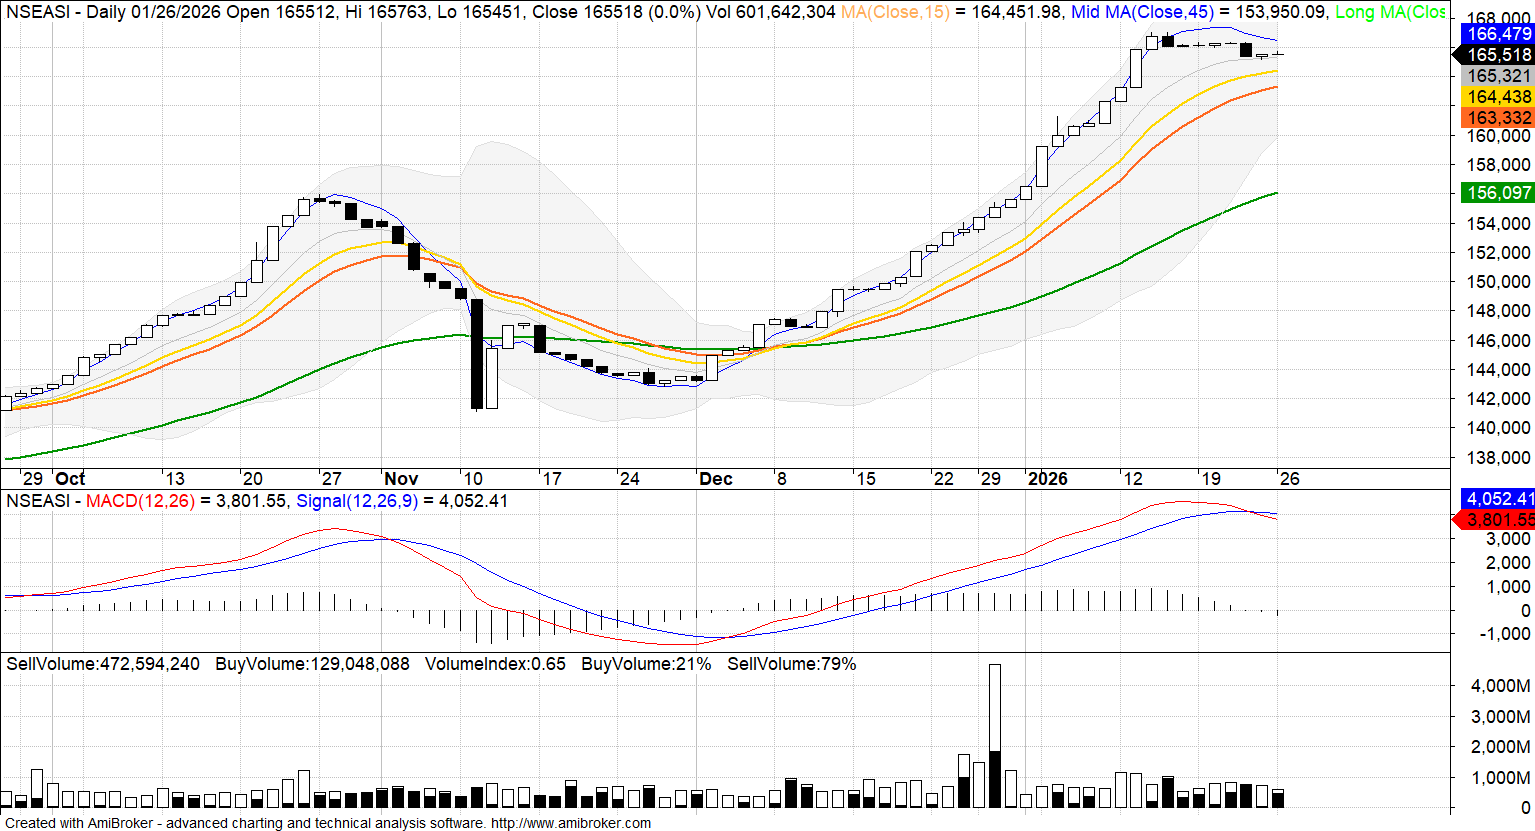
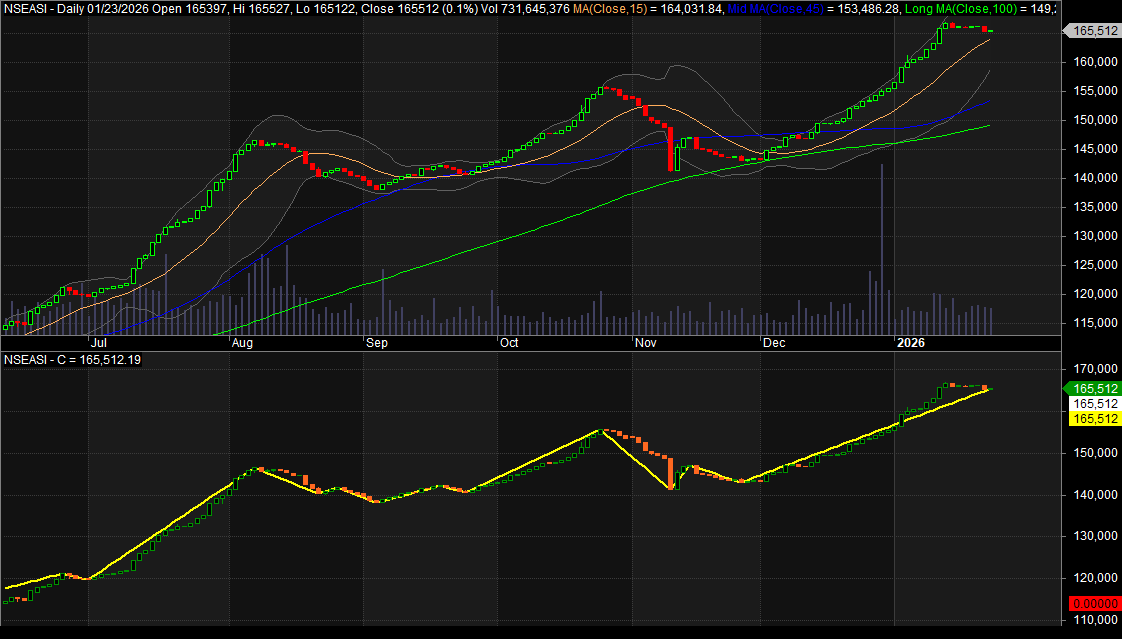
Meanwhile, the composite index NSEASI shed 102.39 points to close lower at 26,223.54 points, from an opening figure of 26,325.93 points, representing 0.40% decline on improved volume of trades to reverse its previous week bullish transition on a buying volume of total transactions for the week was 29%, while selling position was 71%. Despite the volatility in the market, the earnings season draws closer for discerning investors and traders to position in fundamentally sound equities with high possibility of dividend payment in the coming earnings season which is expected to drive price in the short and medium term.
Market breadth for the week was weak, but positive as 30 stocks appreciated in value while 27 lost value during the period.
NSEASI WEEKLY TIME FRAME

The NSE’s ASI on a weekly time frame had just pulled back from a week’s recovery on improved volume as profit taking and indecision among traders and investors characterized activities. The market has broken down from the earlier index action formation of symmetrical triangle which is a continuation chart pattern.
The index has broken down the black line of its recent support level at 26,325.93 to confirm the pullback. The reversal of the index around 61% Fibonacci retracement equally reflected on the downward trend, as the index closed 0.4% lower for the period. The momentum and trending ability of the market on weekly frame is weak, as ADX is below 20 for the period at 16.41.
Traders should watch out as the pullback is likely to continue or reverse, depending on the outcome of the MPC meeting. The first support level is at 26,160.76 and the second support at 25,985.23 point, any move up to 26,398.12 and 26,563.34 respectively.
Looking at technical indicators, the NSEASI closed above the lower band by 32.6%, while MACD has been bearish in the last 15 trading days. RSI is reading 44.33 at relatively strong. Money flow index on a weekly basis is flat, while daily is looking down to indicate that funds are leaving the market. The momentum indicators are mixed as RSI, CCI and MACD are signaling buy, while SO is indicating sell.
AIICO

Aiico was flat in the past week on a positive sentiment, owing to its low price attraction to traders, after it had remained on the down trend for almost two years as a result of mixed financials and the market direction. But with the double bottom formation of its price action, reversal is imminent.
Traders should watch for first resistance level of N0.65 and second resistance level of N0.70 or reverse down to touch first support level at N0.57 and the second support level will be at N0.55 per share. The stock is trading below its 20-Day moving average at N0.60 per share. The current trend is strong on weekly and daily time frame as ADX is above 20.
Looking at technical indicators, AIICO closed above the lower band by 42.1%. MACD is bullish, RSI is reading 43.75 which is at accumulation stage. The momentum indicators are mixed as SO and RSI are signaling sell while MACD and CCI are indicating buy. MFI is looking down to indicate that funds are exiting the stock. The buy to sell volume indicator reveal 100% buy volume of the stock for the week and last Friday trading.
CONTINENTAL REINSURANCE

Continental Reinsurance moved 10.91% higher over the past week on a bullish sentiment as market players take positions in dividend income stocks. This is even more pronounced at a time of improving financials in a tight business environment to form a bullish channel with high possibility of breakout of the channel. The current trend momentum and direction on a weekly is weak but strong on daily time frame above ADX 20 at 26.77.
Traders should watch out as the uptrend has the possibility of breakout of the upper line of the bull channel at N1.26 and second resistance price of N1.30. Watch for any move down the first support level of N1.18 and second support level (S2) at N1.15per share. The stock is trading above its 20 and 50-Day moving average.
Looking at technical indicators, CONTINSURE closed above the upper band by 39.0%. Although prices have broken the upper band and an upside breakout is possible, the most likely scenario is for the current trading range that CONTINSURE is in to continue. MACD is one day bullish. RSI is reading 69.80 on overbought region. The momentum indicators like RSI and CCI are in their overbought range and signaling sell, while MACD just signaled buy as at closed trade on Friday. MFI is looking up on daily and weekly timeframe. The buying to selling volume index revealed a weekly buy position of 100% and sell position of 0%.
FORTE OIL

FO fell by 10.14% over the past week on a bearish sentiment as pullback continued to forming of a double bottom that supports reversal in the short time. The trend momentum and direction is strong on weekly and daily as ADX is above 20.
Traders should watch out for a reversal of trend at the first resistance price level of N74 and second resistance level of N81, any move down to the first support level of N60 and second support level at N57. The stock is trading below its 20 and 50-day moving average.
Looking at technical indicators, FO closed below the above band by 16.81%. MACD is bearish for just one day trading. RSI is reading 30.02, while all momentum indicators like MACD, SO, CCI and RSI are signaling buy. MFI is looking DOWN, to indicate that funds are exiting the stock, with selling volume position of 100% and buy position of 0% for the week.
GUINNESS

Guinness fell by 8.24% over the past week on a mixed sentiment as outlook for its sector remains weak with sales remaining stagnated. Its price action has broken its strong support level at N72 to low of N62 which indicates reversal is imminent within the descending triangle chart pattern. The current trend and direction is strong as ADX on weekly and daily time frame is above 20.
Traders should watch out for uptrend move to first resistance level at N73 and any move down to the first support level at N62. The stock is trading below its 20 and 50 day moving average.
Looking at technical indicators, GUINNESS closed below the lower band by 4.3%. Although prices have broken the lower band and a downside breakout is possible, the most likely scenario is for the current trading range that GUINNESS is in to continue. MACD is just a day bearish. RSI is reading 30.28, while other momentum indicators like MACD and SO are signaling sell while CCI and RSI are indicating buy. MFI is looking up, to indicate that funds are entering the stock, with buying volume position of 62% and sell position of 38% for the week.


