Company: UAC of Nigeria Plc
Rating: Hold
Current Market Price: N6.50
Year High: N9.60
Year Low: N4.50
Fair Value: N9.12
Equity Analyst: Tunde Segun Jeariogbe
Key Investment Ratios
• In this report, we observed the financial statistics of UAC of Nigeria Plc for the nine months ended 30th September 2019, compared the same to figures released in the corresponding period of 2018, and establish growth status.
• The valuation was done with full-year financials for proper representations of the company’s performance while ensuring the right projection.
• Ordinarily, the group would have reported a profit for the period, but it suffered a loss of N17.45 billion on its discontinued businesses, which swallowed the entire N4.70 billion profit, dragging the company to a loss position.
• In our opinion, since the on-going restructuring process in UACN is depleting the company rather than improving its working capital, there will be a need for strategic repositioning in its food business to rebuild and enable it regain lost ground. Consequently, appropriately predicting how long it will take to recover from this loss will largely depend on the management’s effectiveness.
• Expectedly, the management of UACN should take advantage of various government policies aimed at empowering local firms, especially those in the food sector of the economy, if it must return to its days of yore.
• Write back of barred unclaimed dividend accounted for N206.34 million of the stated other operating income in the report under consideration.

Company figures
• Specifically, turnover for the period improved by 12.60% to N60.54 billion, as against the previous N53.77 billion.
• The cost of sales also increased by 11.75% from the previously reported N43.24 billion to N48.32 billion.
• Operating Profit grew over the comparable period by 46.12% to N4.63 billion, from N3.17 billion achieved at the end of 2018 nine-month.
• Operating Expenses inched up by 9.90% to N8.79 billion as against the previously estimated N7.99 billion.
• Finance Cost grew by 52.02% to stand at N292.04 billion, compared to N192.11 billion in 2018 third quarter.
• Profit before Tax was estimated at N6.55 billion; same as 30.71% above the N5.01 billion estimated in 2018.
• Please understand that Profit before Tax was income made on short-term bank deposits YTD
• Having considered the tax expenses, the company earned N4.70 billion YTD profit, but after considering the loss after tax on discontinued business for the period, it reported a YTD loss of N12.75 billion, which was far above the Loss after Tax of N994.29 million reported in 2018 nine months financial performance report.
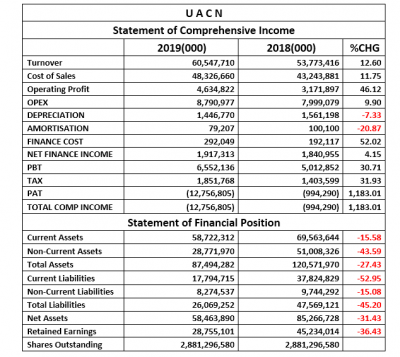
• Current Assets at the end of the period was valued lower at N58.72 billion, same as 15.58% below the N69.56 billion in 2018.
• Similarly, Non-Current Assets was valued at N28.77 billion, 43.59% down from the N51.08 billion posted in the 2018 nine months result.
• Current Liabilities equally dropped by 52.95% to N17.79 billion from N37.82 billion.
• Non-Current Liabilities dipped by 15.08% to N8.27 billion as against N9.74 billion in the corresponding quarter.
• Net Assets dipped to N58.46 billion from N85.26 billion in 2018.
• In the same trend, Retained Earnings dipped by 36.43% to N28.75 billion, compared to N45.23 billion posted in the 2018 third-quarter result.
Financial Strength/Solvency Ratios
• Total Debt Ratio is currently estimated at 0.30x down from the previously estimated 0.39x, which confirms the declining Debt-over-Assets.
• Total Debt to Equity ratio is estimated at 0.45x as against 0.56x.
• Total Equity value at the end of the period had been estimated at 67% of the Assets value, which is lower than the 71% estimated from 2018 third-quarter earnings figures.
• UACN can be said to be less liquid than the market since the estimated Beta value is currently below the market beta and also below its industrial average.

Profitability Ratios
• The pre-tax margin is currently estimated as 10.82% as against 9.32% last year.
• Cost of Sales is fairly controlled through the period with a downward difference of 0.75%.
• Return on Equity is negative as shown in the table below; this is due to the loss posted at the end of the quarter.
• Similarly Return on Assets is Negative.

Efficiency Ratios
• Operating Expenses to Turnover value is the same as 14.52%, this is 2.40% drop in efficiency from the 14.88% estimated from 2018.
• Turnover to Total Assets Ratios stood at 69.20% from 44.60%. when this is compared to the ratio estimate in 2018 result, it is a 55.17% improvement in efficiency
• Working Capital Turnover, a ratio that indicates a company’s effectiveness in using its working capital, was estimated at 1.48x as against the 1.69x estimated in the similar period of 2018.
• We also tested the Working Capital Ratio, which confirmed that the Current Asset is higher than current liabilities at the end of the period.

Investment/Valuation Ratios
• As noted above, the management of UACN reported a loss after tax to the tune of N4.43 per units shares, this is far above the N0.35 loss in a similar period of 2018
• Due to the loss position in the two quarters compared, the PE-Ratio is currently negative
• Similarly, the yield of the said loss per share on the current market price is negative
• The estimated Book Value of UACN is far above the current market price. Note that we have currently estimated the book value at N20.29 down from the previous estimate of N29.59
• See the below table for other investment ratios.

Valuation
Due to the negative earnings status of the company, we have chosen to be conservative in our valuation approach, especially since Net Assets is dropping and dividend is still being paid. Nevertheless, we have, therefore, channelled our valuation energy to the dividend performances, following which we arrived at N9.12 as our fair value, considering the restructuring currently going on in the company and various government policies favouring local businesses, we have rated UACN a HOLD.


