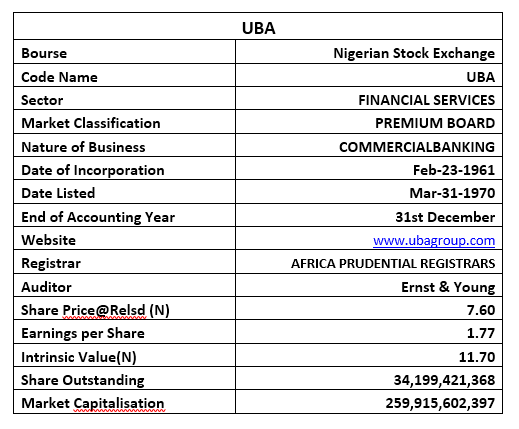
Rating: Buy
Current Market Price: N7.60
Loan to Deposit Ratio: 41.86%
Year High: N9.25
Year Low: N6.75
Fair Value: N11.70
Equity Analyst: Tunde Segun Jeariogbe
Key Investment Ratios
- This report observed the half-year performance indices of United Bank for Africa UBA for the period ended 30th June 2021, compared the numbers with similar figures released in the first half of 2020 to establish growth and make projections, where necessary.
- We adjusted our valuation slightly above that of the first quarter to accommodate improvements in performance indices.
- It is noteworthy that, our valuation, though conservative, is more appropriate for long-term investors, as it was projected for five financial years. Despite this, we expect short-term traders to play within the technical trading gap.
- Generally, the half-year performance can be rated average, especially the corresponding growth registered in the quarter’s profit, against that of the comparable period in 2020.
- See below for detailed analysis of the released numbers.

Interim Dividend Information
- At the end of the period, the board of UBA Plc announced a 20 kobo cash dividend per share, representing a 17.65% growth over the 17 kobo paid for the corresponding half-year of 2020.
- The said dividend is 11.29% of the total earned on each of its shares outstanding for the period, which although higher than what was paid last year, the pay-out is lower than that of last year.
- Meanwhile, the said dividend is 2.63% of the price of UBA on the Nigerian Exchange as of the time the dividend was announced to investors. Note that the yield is about the same as the previous half-year.
- According to the document announcing the corporate action, the closure date is Friday, 24th September 2021, which follows that the qualification date is 23rd September, while the payment date is 30th September, 2021
- See the table below for details

Company figures
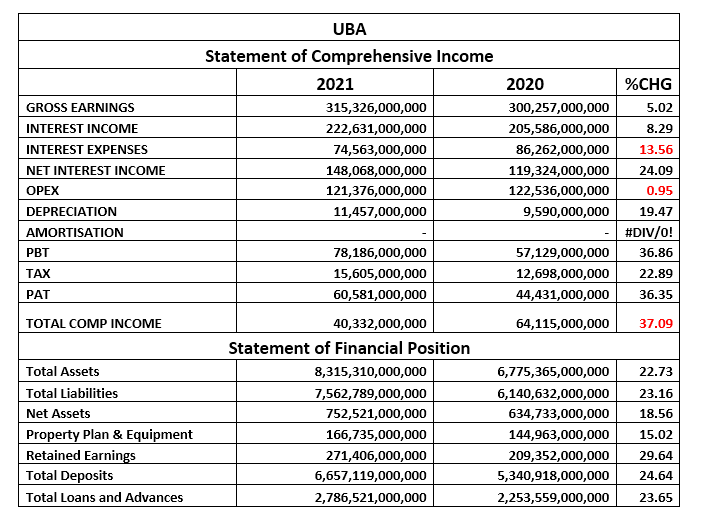
- Gross Earnings through the quarter was N315.26 billion, same as 5.02% above the N300.25 billion posted in its 2020 second quarter figure.
- Interest Income appreciated by 8.29% to N222.63 billion, against N205.58 billion in the corresponding period of last year.
- Interest Expenses is currently valued at N74.56 billion, which is 13.56% below the N86.26 billion posted at the end of first half of 2020.
- Operating Expenses is estimated at N121.37 billion, mildly lower than the N122.53 billion used through the prior half-year by 0.95%.
- Profit before Tax is estimated at N78.16 billion, versus N57.12 billion in the comparable period of 2020.
- After taking care of the Tax Expense, the board of UBA reported a net N60.58 billion as profit, 36.35% higher than the N44.43 billion earned in the similar period 2020.

- At the end of the 2021 period, the group’s Total Assets improved at N8.31 trillion, the same as 22.73% above the N6.77 trillion reported in its 2020 second-quarter earnings document.
- Total Liabilities equally rose above the comparable period by 23.16% at N7.56 trillion, versus N6.14 trillion at the end of 2020 half-year.
- Net Assets stood at N752.52 billion from N634.73 billion posted at the end of the corresponding quarter.
- The total Deposit reported for the six months of 2021 is estimated at N6.65 trillion, 24.64% above the N5.34 trillion recorded in the 2020 half-year.
- Total Loans and Advances at the end of the 2021 first-half financial report was N2.78 trillion, or 23.65% higher than the N2.25 trillion posted in the prior half-year.
- See the above table for details
Financial Strength/Solvency Ratios
- Debt Ratio which compares Total Assets to Total Liabilities stood at 90.95% from 90.63% in the corresponding period of last year. It is noteworthy that a high debt ratio is typical of financial institutions.
- Total Debt for the period can replicate equity 10.05 times, against 9.67 times in the prior half-year, due to the deposit-taking nature of financial institutions; and it is advantageous to equity holders.
- Equity Ratio, which compares Equity to Total Assets, stood at 9.05% against 9.37% in the corresponding period of last year.
- Estimated Beta value for UBA at the time this report was compiled, stood at 1.08x at above the market beta, but below the industry average as of the time this report was compiled.

Profitability Ratios
- Pre-Tax Margin improved by 30.32% at 24.80%, against the 19.03% estimated at the end of 2020 half-year.
- Interest Expenses to Gross Earnings dropped by 17.69% to 23.65% from the previously estimated 28.73%.
- Return on Average Equity through the period was 8.05%, against 7.00% in the similar period of 2020.
- See the table below for detailed profitability ratios and comparison.

Efficiency Ratios
- Operating Expenses for the period is estimated as 38.49% of the Gross Earnings, this is 5.68% below the 40.81% achieved in the corresponding period.
- Gross Earnings is the same as 3.79% of the Total Assets valuation at the end of the half-year, which is 14.43% below the 4.43% estimated in 2020.
- It was equally established that 41.86% of the total deposits was given loans, which is a marginal 0.80% below the 42.19% deposit of the 2020 six-month, and lower than the regulatory 65% threshold.
| EFFICIENCY RATIOS | |||
| TICKERS | 2021 | 2020 | |
| OPEX TO GE | 38.49% | 40.81% | 5.68 |
| GE TO TA | 3.79% | 4.43% | 14.43 |
| LDR | 41.86% | 42.19% | 0.80 |
| Capex/Share | 0.97 | 1.05 | 7.65 |
Investment/Valuation Ratios
- At the end of the quarter, N1.77 was earned on each unit of UBA shares, higher than the N1.30 reported at the end of the 2020 period.
- Our half-year adjusted P/E ratio stood at 1.07x as against 1.26x in the corresponding quarter.
- The above-mentioned earnings per share is the same as 23.31% yield over the price of UBA on the floor of the exchange when the result was first presented, a higher yield when compared to the 19.83% yield of 2020 period.
- The estimated Book Value Per Shares of UBA is currently N22.00, same as 18.56% above the N18.56 estimated at the end of 2020 first half.
- Thus, Price to Book Value stood at 0.35x as against the 0.35x of the preceding half-year, which simply implies that the stock is currently selling below its book value on the exchange.

Valuation
While trying to place a fair value on each unit of UBA Holdings shares, we considered the average of two valuation models. FCFE Stable Growth Model valued the stock at N18.40 while H-Model placed the price at N4.99. We, therefore, arrived at an average value of N11.70 for each unit of its listed shares. Therefore, we have Rated UBA shares a ‘BUY’ considering the gap between our valuation and the current market price of UBA on the floor of the exchange.
FIVE YEARS FINANCIAL HISTORY
| UBA | |||||
| FIVE (5) YEARS HISTORY | |||||
| 2020(Mill) | 2019(Mill) | 2018(Mill) | 2017(Mill) | 2016(Mill) | |
| Gross Earnings | 620,375 | 559,805 | 494,045 | 461,557 | 383,647 |
| Interest Income | 427,826 | 404,830 | 362,922 | 325,657 | 263,970 |
| Interest Expenses | 168,395 | 182,955 | 157,276 | 118,025 | 98,770 |
| OPEX | 229,842 | 201,677 | 185,541 | 178,519 | 143,851 |
| PBT | 131,860 | 111,287 | 106,766 | 105,264 | 90,642 |
| TAX | 18,095 | 22,198 | 28,159 | 26,674 | 18,378 |
| PAT | 113,765 | 89,089 | 78,607 | 78,590 | 72,264 |
| TOTAL COMP INC | 157,091 | 89,089 | 45,334 | 106,359 | 138,150 |
| SHARES OUTSTANDING | 34,199 | 34,199 | 34,199 | 34,199 | 32,981 |
| DIVIDEND | 0.35 | 0.80 | 0.65 | 0.65 | 0.55 |
| TOTAL DEPOSIT | 6,094,168 | 4,099,954 | 3,523,956 | 2,867,637 | 2,594,690 |
| TOTAL LOAN & ADVANCES | 2,632,394 | 2,169,358 | 1,731,082 | 1,671,531 | 1,528,084 |
| RETAINED EARNINGS | 255,059 | 184,685 | 168,073 | 154,527 | 138,623 |
| NET ASSETS | 724,148 | 597,978 | 502,608 | 529,434 | 448,069 |
| ESTIMATED RATIOS | |||||
| EPS(N) | 3.33 | 2.60 | 2.30 | 2.30 | 2.19 |
| TCI/SHARE | 4.59 | 2.60 | 1.33 | 3.11 | 4.19 |
| PE Ratio | 2.40 | 2.48 | 2.70 | 5.00 | 2.46 |
| Earnings Yield | 41.58% | 40.39% | 37.07% | 19.98% | 40.65% |
| BV | 21.17 | 17.49 | 14.70 | 15.48 | 13.59 |
| P/BV | 0.38 | 0.37 | 0.42 | 0.74 | 0.40 |
| PBT MARCGIN | 21.25% | 19.88% | 21.61% | 22.81% | 23.63% |
| PROFIT MARGIN | 18.34% | 15.91% | 15.91% | 17.03% | 18.84% |
| ROE | 15.71% | 14.90% | 15.64% | 14.84% | 16.13% |
| ROA | 1.48% | 14.90% | 1.61% | 1.93% | 2.06% |
| LOAN TO DETPOSTI RATIO | 43.20% | 52.91% | 49.12% | 58.29% | 58.89% |


