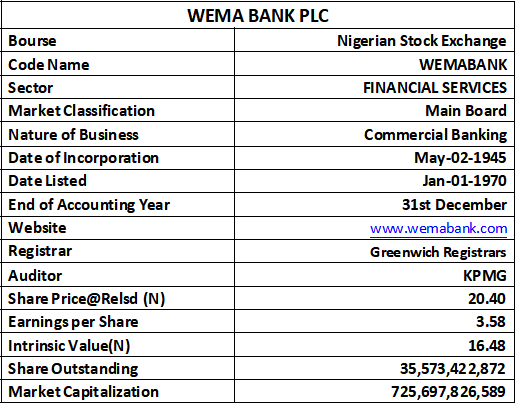
Quarter Under Preview: 9-Months
Current Share Price: N19.90
Price At Released: N20.40
Latest Final Dividend: N1.00
Latest Interim Dividend: N
Estimated Beta Value: 0.45x
Estimated Intrinsic Value: N16.48
Analyst: Jeariogbe Tunde Segun
The Bank
Incorporated in 1945 as a Private Limited Liability Company under the name: Agbonmagbe Bank Limited, Wema Bank Plc commenced operations in Nigeria in the same year. It subsequently transformed into a Public Limited Liability Company (PLC) in April 1987 and was listed on the Nigerian Exchange Limited (NGX), formerly Nigerian Stock Exchange (NSE) in January 1990.
On February 5, 2001, Wema Bank Plc was granted a universal banking license by its primary regulator- the Central Bank of Nigeria (CBN), thus allowing it to provide the Nigerian public with a diverse portfolio of financial and business advisory services. In 2009, the Bank underwent a strategic repositioning exercise which culminated in a decision to operate as a commercial bank with regional authorization under a CBN guideline. Upon a successful turnaround, the bank applied to the CBN for, and was granted a national banking license in 2015.
Wema Bank offers retail banking, SME banking, corporate banking, treasury, trade services and financial advisory to its ever-expanding clientele through a network of over 150 business offices backed by a robust ICT platform across Nigeria.
Released Financials
At the end of the nine-month period under review, the management of Wema Bank reported Gross Earnings of N458.508 billion, same as 58.59% above the N289.117 billion reported at the end of the corresponding period of 2024. Interest Income through the period stood at N396.950 billion versus N229.910 billion in the comparable quarter. Interest Expenses stood at N161.333 billion while Net Interest Income amounted to N235.617 billion versus N105.819 billion in the similar nine months of 2024. Operating Expenses value was put at N131.319 billion versus N86.415 billion. Depreciation equally grew to N8.407 billion from N6.315 billion. Profit before Tax, therefore stood at N146.440 billion as against N60.615 billion. Tax Expenses for the nine months is valued at N19.036 billion, against N7.880 billion, following which Net Profit achieved through the nine months business session is N127.404 billion, higher than the N52.734 billion recorded in the corresponding quarter while the Total Comprehensive Income stood at N132.529 billion against N52.734 billion. See the below table for details.
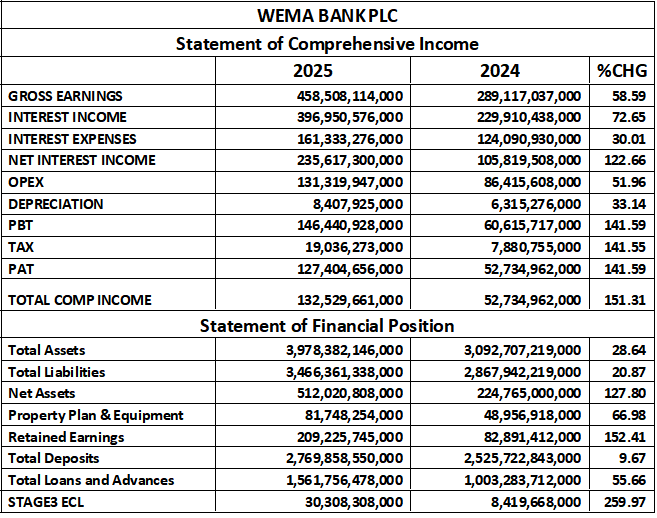
At the end of the nine-month period, the Total Assets of Wema Bank Plc was valued at N3.978 trillion, higher than last year-end’s by 28.64%. Total Liabilities stood at N3.466 trillion from N2.867 trillion, following which the Net Assets is estimated at N512.020 billion versus N224.765 billion. Retained Earnings increased outstandingly to N209.225 billion from N82.891 billion. Total Deposit received for the nine months is valued at N2,769 trillion versus N2.525 trillion, while the Total Loans and Advances dispensed through the quarter is N1.561 trillion against N1.003 trillion in the corresponding quarter, and the stage 3 ECL increased much to N30.308 billion from N8.419 billion. See the above table for details.
Financial Strength Ratios
- Debt Ratio: From the estimated ratio as shown in the below table, meaning that 87.13% of Total Assets were funded through liabilities, which is normal for a commercial bank. The drop from 92.73% to 87.13% shows that:
- Lower dependency on debt/liabilities
- Better balance sheet stability
- Healthier funding structure
This is a positive shift. Wema Bank has strengthened its capital position.
- Equity Ratio: The ratio revealed a strong improvement from 7.37% to 12.87%. This is a very strong movement upward. An equity ratio of approximately 13% is good for a Nigerian mid-tier band and it indicates:
- Improved capital buffer
- Stronger shock-absorption capacity, and
- Better protection for depositors
This aligns with the bank’s recapitalization efforts and retained earnings growth.
- Non-Performing Loan Ratio (Sage3 ECL): An increase from 0.84% to 1.94% indicates deterioration in credit quality, because:
- More loans have slipped into stage 3 (default category)
- Credit risk has increased
- Expected Credit Loss (ECL) provisioning is rising
However, 1.94% is still below the 55 regulatory thresholds. The bank remains within a safe NPL threshold. This is not alarming yet, but the trend requires close monitoring.

Profitability Ratios
- EBITDA Margin: A move from 66.07% to 68.96% indicates:
- Stronger operational efficiency
- Better cost control
- Higher contribution of core banking operations to earnings
For a bank, this suggests strong growth in interest and fee-based incomes with stable operating expenses.
- Pretax Margin: This ratio shows a significant movement from 20.97% to 31.94%, which is one of the strongest improvements:
- Pretax margin rising to 31.94% shows profit before tax is expanding much faster than revenue
- Indicates better management of operating expenses
- Suggests stronger Asset Yield of improved pricing on loans
It is important to note that a jump of 11 percentage points reflects a very productive year operationally.
- Interest Expenses to Gross Earnings Ratio: This ratio equally revealed a strong improvement as it moved from 42.92% to 35.19%. The drop in the ratio means:
- The bank is paying less interest relative to its total earnings
- Cost of deposits or borrowings is reducing
- Funding mix is improving (more low-cost deposits, fewer expensive borrowings)
- Net interest margin should be expanding
This is very positive for long-term profitability view.
- Return on Average Equity (ROAE): Note that: ROAE of 25% is excellent for a Nigerian mid-tier bank, and reflects:
- Strong value creation for shareholders
- Effective deployment of equity capital, and
- Profit growing faster than equity base.
This improvement shows consistent profitability momentum.
- Return on Average Assets (ROAA): This ratio is more than double, and quite exceptional. A 3.2% ROAA means:
- Highly efficient in using assets to generate profit
- Reflects improved asset quality and earnings
- Indicates the bank is extracting deter returns from its loan book and investments
ROAA above 2% is considered strong for a Nigerian bank; therefore 3.2% is outstanding for Wema Bank.

Efficiency Ratios
- Operating Expenses to Gross Earnings: This ratio is improving, moving from 29.89% to 28.64%. A lower Operating Expenses to Gross Earnings ratio is excellent. The declines implies:
- Better cost control
- Improved operational discipline
- Expenses rising slower than revenue
- Stronger overall efficiency
Operating below 30% is quite competitive among Nigerian banks, especially a mid-tier bank like Wema Bank,
- Gross Earnings to Total Asset: This ratio shows a stronger Asset productivity and its movement from 9.35% to 11.52% means that Gross Earnings increased relative to Total Assets, just as it shows:
- Improved utilization of assets
- Better income generation from loans, investment, and tradings
- Stronger balance sheet productivity
This is a major efficiency improvement and reveals that Wema Bank is extracting more revenue from every N1 worth of asset.
- Loan to Deposits Ratio: A growth from 39.72% to 56.38% is significant, and means:
- The bank is lending out more of its deposits
- Has improved risk appetite and boasts of a stronger loan book growth
- More interest-earning assets
- Improved balance sheet inter-mediation
An LDR of 56% is healthy, well within regulatory expectations and shows that the bank is not under-lending. In fact, it is still conservative, as there is room for controlled expansion. This must be monitored together with the rising NPL ratio, since loan growth without strong risk control can spike defaults rate.

Investment Ratios
- Earnings per Share (EPS): Earnings per share increased sharply by about 45% showing:
- Strong improvement in profitability
- Higher returns to shareholders
- Better earnings momentum compared to previous period
This confirms the strong ROE and ROA trends already observed earlier.
- Total Comprehensive Income: This rise in this index indicates:
- That not only the Profit after Tax increased, as other comprehensive income grew also. Others are: fair value gains of financial instruments, FX revaluation gains, and other capital related gains
- This confirms that Wema Bank’s overall financial performance is even stronger than what the EPS suggests.
- P/E-Ratio: Though rising, it is still very low at 1.9x. It is important to understand that a P/E of 1.9x means:
- The stock is still very cheap relative to earnings
- Market may not yet fully price in the bank’s strong performance
- There isa significant upside potential if profitability continues
The rise from 1.08x to 1.9x shows that the market is beginning to recognize Wema’s improving fundamentals.
- Earnings Yield: This ratio is declining due to the rise in market price, although it is still very attractive. The decline is expected because P/E increased. It is noteworthy at this point that even at 17.56%, Earnings Yield remains very attractive. A double digit earnings yield is excellent for investors.
- Book Value per Share: This ratio is increasing substantially, and the increase means:
- Higher retained earnings
- Stronger capital base
- Healthier balance sheet, and
- Shareholder value creation
This aligns with the earlier improvement in the equity ratio.

Final Verdict on Wema Bank Numbers and Ratios
Wema Bank delivered a strong and very-balanced performance across all major ratio categories, strengthening its capital position. The bank reduced leverage and significantly improved profitability with higher margins, stronger ROE, and an exceptional rise in ROA. Operational efficiency also improved, with lower cost burdens and better utilization of assets. Loan growth accelerated meaningfully, supported by an improved funding mix, although this exception contributed to a moderate rise in NPL’s, which must be monitored going forward.
From an investor perspective, the bank remains undervalued based on its low P/E, high earnings yield, and a rising book value that shows strong value creation. Nevertheless, we remain very conservative in placing our Intrinsic Value for Wema Bank as shown above.
In summary, Wema Bank shows robust financial health, impressive profitability momentum, improving efficiency, and strong shareholder value creation. The only caution is the rising NPL trend, but overall performance is very positive and investment outlook remains attractive.


