Rating: Buy
NPL RATIO (Q4-2019):4.30% (Q4-2018:4.98%)
Loan to Deposit Ratio: 54.09%
Year High: N23.50
Year Low: N10.85
Fair Value: N37.06
Fair Value: N37.06
Equity Analyst: Tunde Segun Jeariogbe
Introduction
• In this report, we have observed the audited performance indices of Zenith Bank for the year ended 31st December 2019, compared same with numbers released in the corresponding period of 2018 to establish growth, projections, and valuation accordingly.
• As shown above, the bank successfully reduced its Non-Performance Loan (NPL) ratio to 4.30% from 4.98% at the end of 2018.
• Nevertheless, it only achieved a 54.09% Loan to Deposit ratio which is below the regulator’s 65% standard. Implying that it will be penalised for the shortfall.
• According to the filing on through the Nigerian Stock Exchange, the management of Zenith Bank announced a Cash Dividend of N2.50 per share, in addition to the previously paid Interim dividend of N0.30 each. in other words, total take-home par unit shares for the 2019 full year is N2.80/share.
• Note that the total dividend paid in the 2018 financial year was also N2.80.
• The closure and qualification date for the said dividend are March 9 and 10, 2020, while the payment is booked for March 16, 2020, the same date as the Annual General Meeting at the Shehu Musa-Yar’Adua Centre, Abuja.
• See below for further analysis:

Company figures
• Gross Earnings improved slightly by 5.06% at N662.25 billion, as against the N630.34 billion posted at the end of the 2018 financial year.
• Interest Income, on the other hand, dropped by a marginal 5.57% to N415.56 billion, compared to N440.05 billion in the corresponding period of 2018.
• Interest Expenses grew slightly by 2.82% to N148.53 billion, versus N144.45 billion in 2018.
• Net Interest Income stood at N267.03 billion, same as 9.66% below the N295.59 billion in 2018 financial year.
• Operating Expenses was stable through the two financial years compared, as it only differed by 0.42% at N207.31 billion, versus N206.45 billion in 2018.
• Profit before Tax was estimated at N243.29 billion, 5.01% up from the previous N231.68 billion stated in its 2018 financials.
• The tax rate remained stable through the two financial years compared. It only adjusted up by marginal 0.71%
• Having provided for Tax Expenses, the management of Zenith Bank achieved N208.84 billion net Profit for the year, which is a 7.49% improvement over the N193.42 billion earned at the end of 2018 business session.

• Total Assets value grew by 6.57% to N6.34 trillion up from the previous N5.95 trillion in 2018.
• Total Liability equally improved marginally by 5.16% to N5.40 trillion, as against N5.13 trillion in the 2018 financial year.
• Net Assets grew by 15.46% to N941.88 billion, as against N815.75 billion stated in its 2018 financials.
• Retained Earnings grew to N412.94 billion, same as 28.15% above the N322.23 billion stated in its previous audited numbers.
• Total Customer Deposits was valued at N4.26 trillion, which was 15.50% above the N3.69 trillion deposit in 2018.
• Total Loans and Advances through 2019 business year is estimated at N2.30 trillion, this is 26.46% above the N1.82 trillion in 2018.
Financial Strength/Solvency Ratios
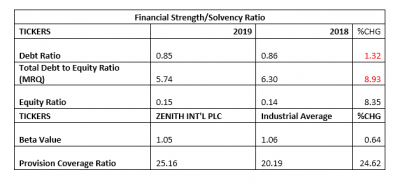
• Debt Ratio was stable through the two compared periods at 0.85x, signifying a controlled assets ratio through the period.
• Total Debt to Equity was estimated at 5.74x, 8.93% below the 6.30x in 2018 full-year numbers, which implies that Total Debt (Deposit inclusive) can replicate Equity 6.30 times
• We have currently estimated a Beta value above the market Beta for Zenith Bank Plc shares. Note that at 1.05 beta value, it is still slightly below the industry average of 1.06.

Profitability Ratios
• Pre-Tax Margin stood at 36.74%, a marginal growth of 0.05% from the last estimate of 36.76% at the end of 2018.
• Interest Expense posted for the period is the same as 22.43% of the Estimated Gross Earnings figure; a reduced position against the previously estimated 22.92%.
• Return Achieved on Average Equity used through the period was outstanding at the estimated at 22.17%. This is below the 23.71% return achieved in 2018.
• See the table below for detailed profitability ratios and comparison.

Efficiency Ratios
• Operating Expenses is estimated at 31.30% of the Gross Earnings Value for the period, is a marginal drop from the 32.75% estimated from 2018 financial statistics and we believe that the ratio can drop further with strict control by management.
• Similarly, Gross Earnings was estimated to be 10.43% of Total Assets, this is 1.41% drop in efficiency when compared to estimate from the corresponding year
• Total Loan to Deposit Ratio achieved at the end of the year stood at 54.09% up from the 49.40% achieved in 2018. Please note that this is below the CBN mandated 65% as noted above.

Investment/Valuation Ratios
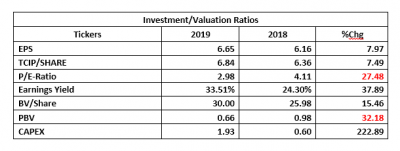
• Profit made on each unit of Zenith Bank shares at the end of the year had been estimated at N6.65 as against the previously estimated N6.16
• Total Comprehensive Income per unit shares is estimated at N6.84.
• Price to Earnings Ratio for the year stood at 2.98x as against 4.11x in 2018.
• The said earnings per share is same as 33.51% of the current market price of Zenith Bank Plc shares on the floor of the exchange when the result was released this is a better yield when compared to the previous year’s yield.
• The current Book Value of Zenith Bank is N30.00, a 15.46% improvement from the N25.98 estimated last year.
• Confirming a seemingly under-priced position is the Price to Book Value ratio that stood clearly below unity.

Valuation
Factoring in marginal improvements in Zenith Bank numbers, our blend of valuation tools priced each unit of Zenith Bank’s shares at a fair price of N37.06. Thus, considering the grossly under-priced position on the floor of the exchange, we Rated the Shares a BUY.


