Nigeria’s leading financial institutions, last week, published their audited earnings reports for the half-year ended June 30, 2020, through the Nigerian Stock Exchange (NSE) as part of post-listing obligations that would enable planning and investment decision making.
One of the pack was Zenith Bank Plc, with numbers showing a tradition of consistent earnings growth, especially over the last decade. This was sustained even in the face of Coronavirus pandemic outbreak which rattled the global economy and financial system, a proof of the bank’s resilience, efficiency and dynamism, which has supported its earnings, profit, share price and dividend payout.
Despite the cloudy business environment, which had led to the huge provision for bad loans at N23.92 billion as against N13.74 billion in 2019, the bank’s aggressive approach to lending and attracting funds, reflected on its loans and deposits, which improved by 45.6% and 28.7% respectively to N2.62 trillion and N4.9 trillion. The bank’s effective cost and risk management efforts lifted its Net Profit Margin to 30% from 26.81% achieved in 2019. All these had also boosted the Loan to Deposit Ratio to 53.5% from 47.29% position in 2019, which is still below CBN requirement of 65%.
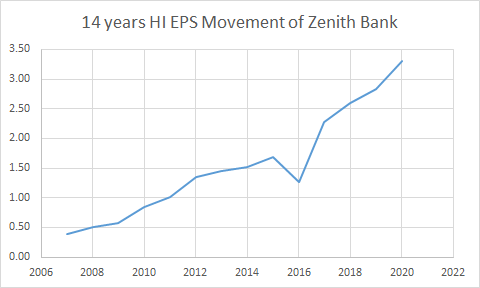
| Year | 2010 | 2011 | 2012 | 2013 | 2014 | 2015 | 2016 | 2017 | 2018 | 2019 | 2020 |
| EPS | 0.84 | 1.02 | 1.35 | 1.45 | 1.51 | 1.69 | 1.26 | 2.27 | 2.60 | 2.83 | 3.31 |
| Interim Dividend | 0.25 | 0.25 | 0.25 | 0.30 | 0.30 |
Zenith Bank’shalf-year numbers show improved performance driven by non-interest revenue, especially from trading and other incomes, following which top and bottom-lines rose, translating to 331 kobo Earnings PerShare from its N103.83 billion profit, which was equally supported by interest income for the period.
Gross earnings were up marginally by 4.37%, to N346.09 billion, from N331.59 billion in 2019, while profit rose by 16.81% from N88.81 billion in the previous year to N103.84 billion, irrespective of the increase in operating costs and reduced tax expenses for the period. The drop in market value for the period reflected on the earnings yield which it moved to 19.51% as of released date, from 14.63% in 2019.
Net assets improved by 20.68% to N988.98 billion, from N819.51 billion in the prior year, as it gets set to become the first Nigeria bank to achieve the N1 trillion shareholders’ funds mark, just as the half-year Price to Earnings ratio dropped to 1.23x from the 1.71x posted in 2019. This is an indication that investors have shorter time to recoup their investment in Zenith Bank, all things being equally.
Book Value for the period grew by 20.68% to N31.50 per share from N26.10 in 2019, while return on equity for same period fell slightly down to 10.50% from 10.85% in 2019, just as growth in deposit base and loans size are signs that a management is proactive and making more impact in the system, while creating value for stakeholders. The bank’s liquidity and capital adequacy ratio have also remained above the regulatory thresholds of 58.4% and 23% respectively.
| ZENITH BANK PLC | |||
| HALF YEAR AUDITED REPORT 2020 | |||
| Year | 2019 | 2020 | |
| (N) | (N) | % Chg | |
| Date Released | August 19, 2019 | Sept 3, 2020 | |
| Price as@ Released Date | 19.35 | 16.95 | -12.40 |
| Gross Earnings | 331,586,000,000 | 346,088,000,000 | 4.37 |
| Profit After Tax | 88,806,000,000 | 103,826,000,000 | 16.81 |
| Shareholders’ Fund | 819,514,000,000 | 988,978,000,000 | 20.68 |
| ESTIMATED RATIOS | |||
| Earnings Per Share | 2.83 | 3.31 | 16.81 |
| PE Ratio (x) | 1.71 | 1.28 | -25.15 |
| DPS | 0.30 | 0.30 | |
| Earnings Yield (%) | 14.63 | 19.51 | 17.16 |
| Book Value | 26.10 | 31.50 | 20.68 |
| Price To Book | 0.65 | 0.54 | -17.38 |
| ROE (%) | 10.85 | 10.50 | -3.23 |
| Profit Margin (%) | 26.81 | 30.00 | 11.90 |
| ROA (%) | 1.40 | 1.37 | -2.14 |
| LDR (%) | 47.29 | 53.50 | 13.14 |
| Opex To Gross Earnings | 34.84 | 35.14 | 0.86 |
| Year End | Dec | Dec | |
The huge investment in ICT to drive innovative service delivery and new products development in the corporate and retail banking space, has continued to propel its earnings capacity as reflected in efficiency, investment and profitability ratios. This reveals the high margin of safety at 85.84% of the market value in relation to the bank share value as at released date; just as the 33.52% retained earnings growth has boosted the net assets and balance sheet to N420.20 billion from N314.70 billion in 2019. It is yet another pointer to the banks robust balance sheet and quality asserts class that supports future dividend growth. The consistent growth seen in its book value is encouraging and exciting for discerning investors and traders, considering the nature of its services and role in economy development.
Valuation
Looking at the investment and valuation ratios of the bank which is mixed, the consistent growth in earnings on a quarterly and yearly basis, has reduced the waiting period of investors at revealed by the growth in Price to Earnings Ratio of 1.23x, from 1.71x in 2019. This is a pointer to the undervalued state of the bank’s shares.
On the strength of this half-year earnings report, we upgrade the target price to N34.12 per share. This guidance is indicative of the stronger performance posted in the period under review.
Meanwhile, the Book Value at N31.50 per share also reveals the high margin of safety the stock offers discerning investors.
Analysts Opinion/Recommendations
| As predicted in our previous analysis and updates on Zenith Bank’s 2019 full-year and 2020 first quarter results, trading and other incomes supported the profit line which is actually obvious in these numbers. It made up reasonably for the low-interest regime and declining fee and commission income. Consequently, the recent cut in interest rates on savings accounts will help the bank’s bottom line in the midst of the over-regulation in the sector and headwinds in the current financial year. We however expect that the management will give serious consideration to the need to boost the bank’s subsidiaries outside Nigeria, so as to make them contribute more meaningfully to top and bottom-line, while reducing exposure to Nigeria’s operating environment. Traders and investors with short, medium and long-term goals, who desire to preserve capital, should look the way of this stock, because we expect that investment in the stock over the next 180 days will beat any form of returns from other investment windows. We therefore recommend a BUY |
Technical View
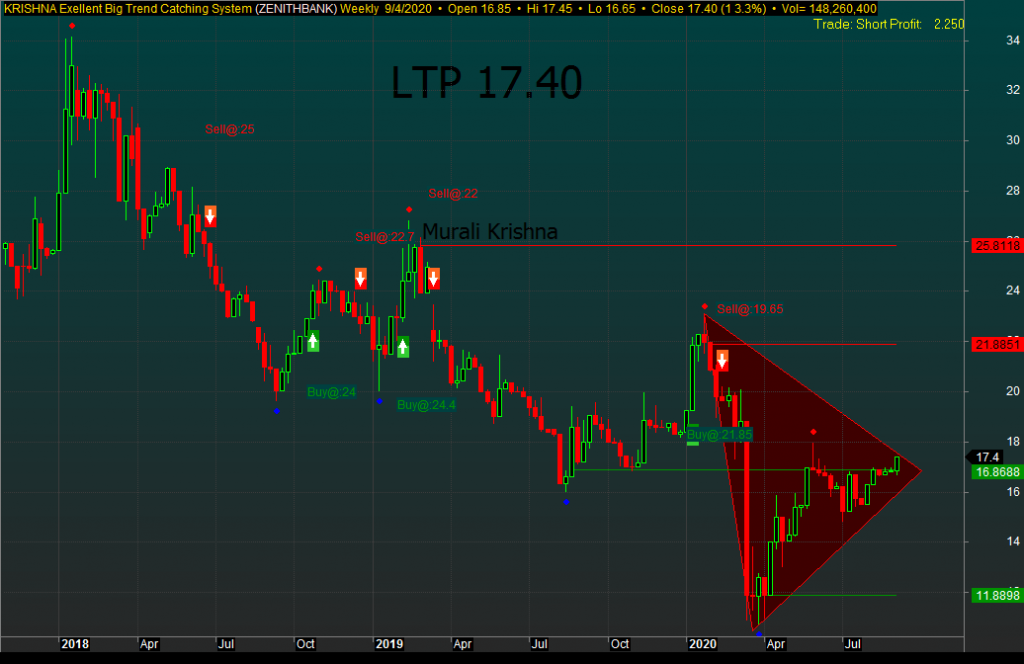
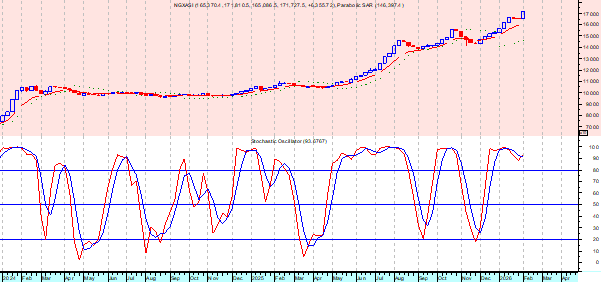
Zenith Bank’s price action has recently formed a symmetrical chart pattern that signals trend continuation or pullback, depending on market forces, as the bank’s financials beat investors’ expectation to breakout the recent resistance level of N17, after being on a downtrend for over three years. The stock is trending up within a bullish channel on strong buying sentiments. The candlestick formation supports within the triangle but depends on market forces in the new week as profit taking is equally underway.
The bank’s RSI is reading 52.45, while Money Flow Index is looking up at 54.72 signaling that funds are entering Zenith Bank on a weekly time frame and also on wave three that indicates an uptrend.
For over five months now, the bank’s price action has oscillated upward, just as the bank is trading above its 20 and 50-day moving average on the weekly chart at N17.40 per share.
| ZENITH INT’L PLC | |
| Share Holding Structure | |
| Jim Ovia | 11.29% |
| Stanbic Nominees Nig. Ltd | 18.06% |
| Nigerian Citizens & Associations | 70.65% |
| Other Statistics | |
| Shares Outstanding (MN) | 31,396,493,786 |
| Open Price (2020) | N18.50 |
| Half Year Close Price (2020) | N16.10 |
| Closing Price as at Sept 4, 2020 | N17.40 |
| Date Listed | 21/10/2004 |
| Year End | 31st Dec. |
Four-Year Performance (2016-2019)
A critical look at the bank’s performance for the past four years shows a consistent improvement in top and bottom lines, except 2018 when it recorded a slowdown in the investment and profit ratios. The high and low performance of the bank is revealed by numbers in the tables below.
Gross income for the period oscillated to reflect changes in the economy, moving from N508bn in 2016, when it touched the highest point within the period at N745.19bn, before falling in 2018 to N630.34 billion and thereafter rebounding in 2019 to N662.25 billion. Profit has constantly been on the uptrend over the last four years, growing by 61.1% to N208.84bn from N129.65bn in 2016. Earnings Per Share remained strong and steady at N6.65, regardless of the level of over-regulation in the industry and the unfriendly economic situation, especially with the high Monetary Policy Rate (MPR), tight liquidity, rising inflationrate, dwindling discretionary income, and falling naira value.
Earnings capacity also rose from 413 kobo in 2016 to 566 kobo in 2017, and 616kobo and 665 kobo in 2018 and 2019 respectively, despite the various headwinds in the bank during the years. Its stable movement in Earnings Yield is a plus, despite the decline from 28.03% in 2016 to 18.25% in 2017 and uptrend since then to 24.3% in 2018 and 34.20% in 2019.
| ZENITH BANK: FOUR-YEAR FINANCIAL PERFORMANCE | ||||
| 2016 | 2017 | 2018 | 2019 | |
| Date Released | Feb 27, 2017 | March 12, 2018 | Feb 19, 2019 | Feb 21, 2020 |
| Price @ Released Date | 14.73 | 30.90 | 25.35 | 19.45 |
| Gross Earnings | 507,997,000,000 | 745,189,000,000 | 630,344,000,000 | 662,251,000,000 |
| Profit After Tax | 129,652,000,000 | 177,614,000,000 | 193,424,000,000 | 208.843,000,000 |
| Shareholders’ Fund | 704,465,000,000 | 821,658,000,000 | 815,751,000,000 | 941,886,000,000 |
| Dividend | 2.70 | 2.75 | 2.80 | 2.80 |
The bank’s strategic risk and cost management efforts are paying off in its determination to reduce non-performing loan ratio and improve profit margin to support the steady growth in profit, dividend payout, and impact on the economy through its social responsibility.
Similarly, over the years, its Book Value has grown in the same direction from N22.44 per share in 2016 to N26.15 in 2017; N25.98 by 2018 and then, N30.00 per share. The consistent earnings growth and Investor confidence are expected to support its price, given that valuation tools place the bank’s stock at N36 per share.
| ZENITH BANK- ESTIMATED RATIOS | ||||
| 2016 | 2017 | 2018 | 2019 | |
| Earnings Per Share | 4.13 | 5.66 | 6.16 | 6.65 |
| PE Ratio | 3.57 | 5.48 | 4.11 | 2.92 |
| Earnings Yield (%) | 28.03 | 18.25 | 24.30 | 34.20 |
| Book Value | 22.44 | 26.17 | 25.98 | 30.00 |
| ROE (%) | 18.40 | 21.62 | 23.71 | 22.17 |
| Profit Margin (%) | 25.52 | 23.83 | 30.69 | 31.54 |
| Year End | Dec | Dec | Dec | Dec |
Analyst: Ambrose Omordion
CRO|Investdata Consulting Ltd
info@investdataonline.com, info@investdata.com.ng
ambrose.o@investdataonline.com, ambroseconsultants@yahoo.com
Tel: 08028164085, 08032055467


