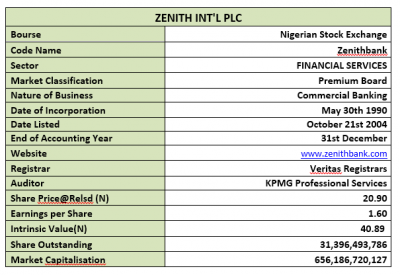
Coy: ZENITH BANK PLC
Rating: Buy
Current Market Price: N21.35
NPL RATIO: 4.98%
Year High: N26.85
Year Low: N20.00
Fair Value: N40.89
Equity Analyst: Jeariogbe Tunde Segun
Key Financial Ratios
• This report observes the financial performance of Zenith Bank Plc for the first three months of 2019 and compares same with released financials for a similar period in 2018 to establish growth/declines.
• Non Performing loan ratio as at the end of the full year financial performance of 2018 is 4.98%, up from 4.70% in its full-year financial performance for 2017.

Company Figures
• Gross Earnings reported for the period stemmed slightly below the comparable year at N158.11 billion, as against the N169.19 billion posted in a similar period of 2018.
• Interest Income grew marginally by 4.94% to stand at N122.48 billion compared to N116.71 billion in Q1-2018.
• Interest Expense stood at 22.21% below similar period in 2018 at N36.34 billion, from N46.72 billion.
• Profit before Tax builds by 6.10% to N57.29 billion, as against N54.00 billion achieved at the end of the first three months of 2018.
• Similarly, Profit for the Period stood at N50.23 billion, which is 6.70% above the N47.07 billion reported in 2018 first quarter.
• Nevertheless, due to foreign currency translation loss, Total Comprehensive Income for the period stood at 15.87% below that of 2018. Please note that the amount reported is N43.63 billion against N51.86 billion last year.

• Retained Earnings equally improved by 8.12% to N290.41 billion, up from N268.59 billion last year.
• Total Assets estimate at the end of the quarter stood at N5.879 trillion, which is 3.58% improvement when compared to the N5.675 trillion of the 2018 first quarter.
• Total Liabilities followed a similar trend, improving by 3.19% to N5.098 trillion, compared to N4.940 posted in a similar period of 2018.
• Total Deposit also improved marginally, growing by 5.16% to stand at N3.571 trillion against N3.396 trillion in 2018.
• Loans and Advances improved by marginal 2.01% at N1.792 trillion against N1.757 trillion.
• Net Assets is currently estimated at N780.88 billion as against N735.24 billion in 2018.
Volatility Ratios
• Estimated beta value for Zenith Bank shares stood below industry average and fairly above the market beta (unity). This signifies its liquidity and patronage by the investing public.
• Although almost irrelevant since this is an analysis of a financial institution whose major business is deposit mobilization (usually reported under liability), we estimated Debt to Equity to be 6.53 times bigger than the Equity value. This is slightly above the industry average of 6.09 times.

Profitability Ratios
• Interest Expense to Gross Earnings is presently estimated at 22.99%, which is 16.76%% lower than the 27.61% estimated in 2018.
• PBT margin stood at 36.24% as against 31.92% last year, this is 13.53% improvement.
• Similarly, Profit margin looks up against last year. We have estimated 31.77% margin from Gross Earnings as against the previous estimate of 27.83%.
• Return on Average Equity is now 6.43% compared to the 6.40% returns achieved in 2018.
• Return on Average Assets only differs marginally by 3.01%, moving from 0.85% to 0.83%.

Efficiency Ratio
• Gross Earnings to Total Assets is estimated at 2.69%, which is 9.78% lower than the estimate in 2018.
• Similarly, Gross Earnings to Equity is now 20.25% as against the 23.01% estimated from 2018.
• Financial Leverage is 7.53x, from the previous 7.72x, an estimate of the number of times the total assets replicates the equity, in other words, the ratio got better.
• It was also established that 50.18% of the Total Deposit was given out as Loan and Advances during the period underestimate. This is 3.00% lower than the 51.73% given out in 2018.
• Meanwhile, Loan and Advances is same as 30.49% of the Total Assets this is 1.52% lower than the 30.96% last year. This shows a controlled/reduced risk compared to 2018.

Investment Ratios
• Just as in the company report above, since shares outstanding remained constant during the two periods under consideration, the estimated amount earned per unit of Zenith Bank shares is N1.16. This is 6.70% above the N1.50 earned at the end of 2018 first quarter.
• Meanwhile, at N1.39 Total Comprehensive Income is 15.87% below the estimated N1.65 in 2018 first quarter.
• The said earnings is a yield of 7.66% of the current market price at the release date and 37.84% better than the 5.55% yield achieved in 2018.
• P/E-Ratio stemmed down to 3.27x as against 4.50x in 2018.
• Price to Book Value revealed an underpriced status at 0.84x, compared to the overpriced position estimated in the comparable period of 2018.
• Book Value per share estimated further confirmed that as at the time the result was made available to the investing public, Zenith Bank share price is selling below its book value. Please see the table below to establish this fact.

Valuation
Our attempt to place a fair value on Zenith Bank took us through several valuation methods after which we settled for the constant perpetual dividend growth rate. We do not expect galloping growth in dividend since this has experienced appreciable growth in the few years prior. To arrive at this value, we estimated a five-year dividend growth rate at 11.03%, and made use of the average. On this strength, we have placed a fair value of N40.89 on each unit the Zenith Bank.


