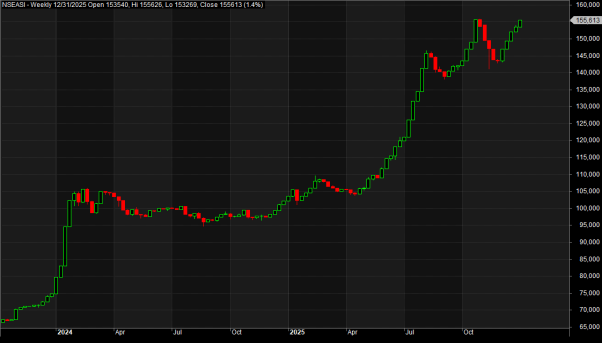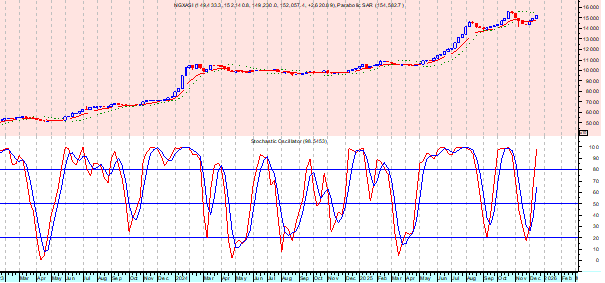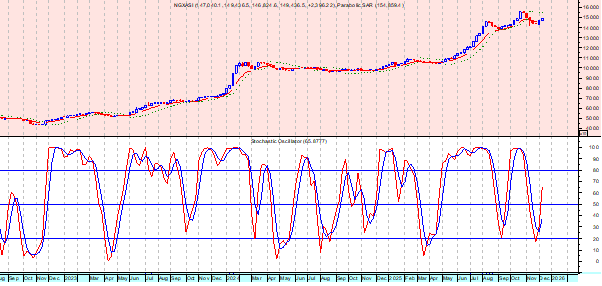
- As Bulls Lose Steam
The last trading week of May witnessed another mixed session on the Nigerian Exchange, closing the month higher on a buying sentiment, amid strong momentum in highly priced stocks. This impacted the benchmark NGX All-Share index positively as it halted previous week’s loss, extending the bull transition seen in the month of April on a very high traded volume and positive market breadth.
The week under review started on a bullish note, with the benchmark index posting 0.79% gain on Monday, a strong upward momentum that was sustained till midweek as the index leaped 1.57% and 0.46% respectively on Tuesday and Wednesday.
However, sentiment changed on Thursday and Friday due to profit booking that resulted to a decline of 0.07% and 0.08% respectively which were not enough to flip the index from its dark green week-to-date close. This brought the week and month total gains to 2.49% and 5.62% respectively.
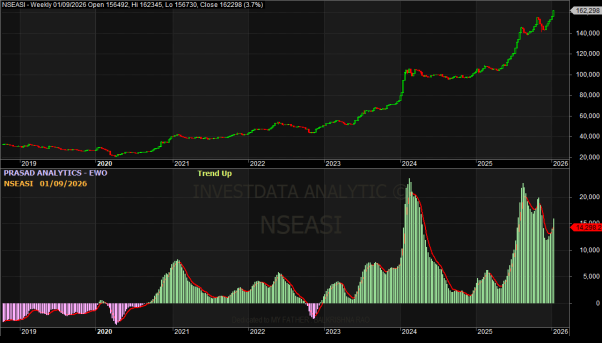
NGXASI Weekly Chart
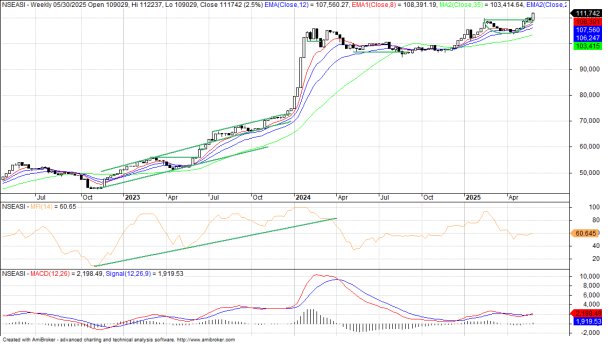
The above weekly chart reveals a breakout that reverses the previous loss position on buying momentum, despite the seeming profit booking after the index had broken out the 112,000 psychological line to test 112,237.30 basis points. Market capitalisation and handle chart pattern formation of the index that signal a continuation of trend on a weekly time frame, even as the daily chart indicates the possibility of a pullback on rising index action and falling MFI in the midst of increasing volume that signals a potential weakness.
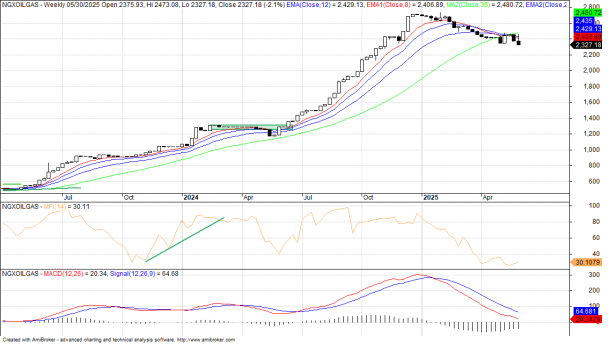
However, within this period, the NGX Oil and Gas Index recorded a 14.19% negative return. In terms of market breadth, 56 stocks advanced, while 44 suffered varing degrees of decline.
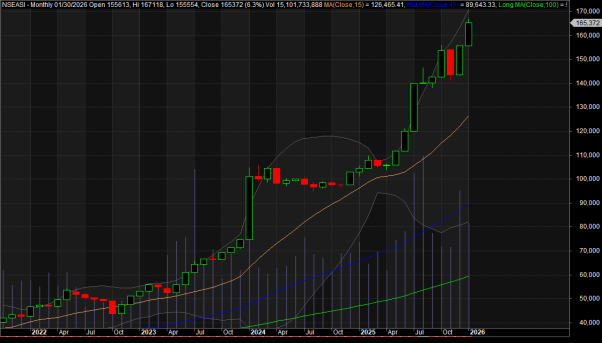
NGXASI Monthly Chart (Opening Chart)
The monthly chart extended its uptrend in May after the formation of a bullish hammer candlestick in April that halted the pullback in March. Consequently, the month-to-date return stood at 5.62%, just as market capitalisation closed at ₦70.463tr, while the All-Share Index settled at 111,742.01 points.
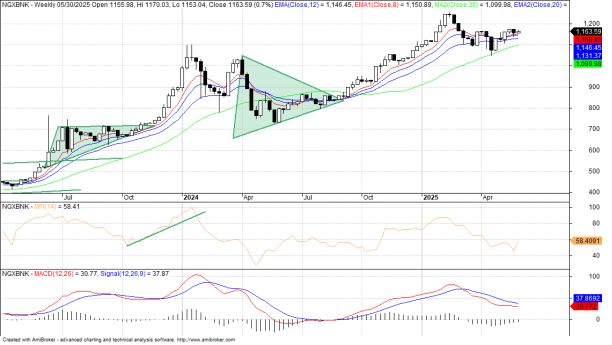
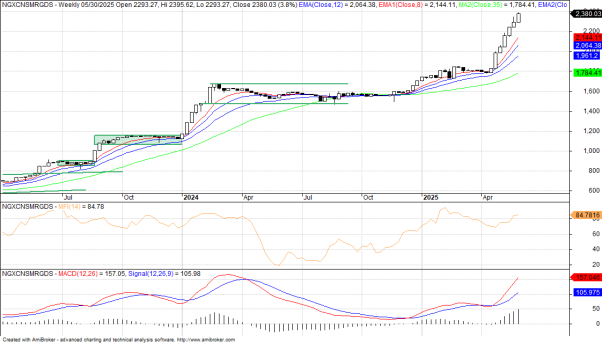
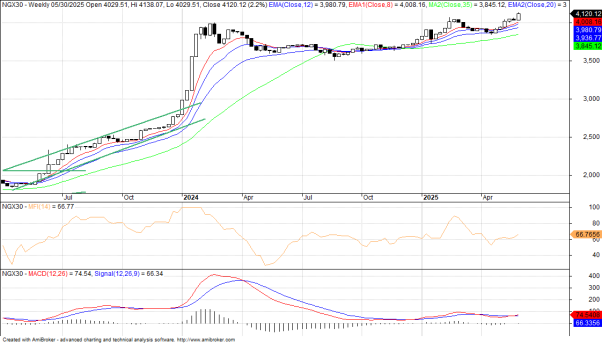
Year-to-date, the broad NGX All-Share Index has gained 8.56%, ahead of the NGX-30’s 8.08%; followed by the Banking Index’s 7.29% rise, but far behind the 15.95% of the Pension Index, which is still a far cry from the 37.44% leap by the Consumer Goods Index. The Oil and Gas Index recorded a negative return of 14.19%, much more than the Insurance Index’s 4.63% slip.
In terms of market breadth for the month, 83 stocks advanced, while 31 declined for the period.
University Press Weekly Chart
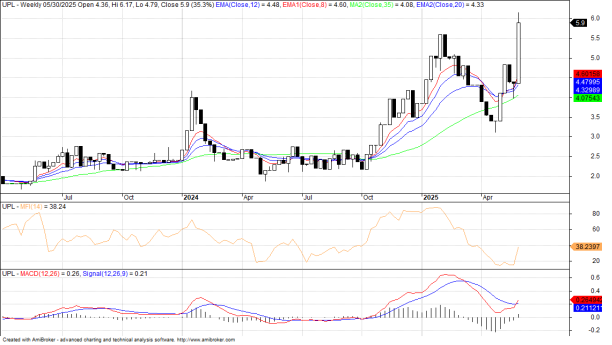
Leading the gainers’ chart was University Press Plc, Nigeria’s largest indigenous book publishing company which recorded the highest price gain during the week from ₦4.36 per share, to ₦5.90 each, representing a 35.32% increase. Red Star Express Plc followed, rising from ₦6.71 to ₦8.32, representing a 23.99% growth. Associated Bus Company Plc advanced from ₦2.49 to ₦2.95, up by 18.47%; Omatek Ventures Plc moved from ₦0.65 to ₦0.78, gaining 20%; Northern Nigeria Flour Mills Plc climbed up from ₦118.70 to ₦138.90, a gain of 17.02%.
Abbey Mortgage Bank Weekly Chart
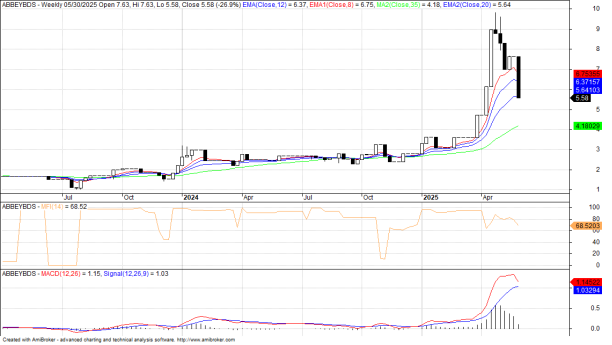
On the decliners chart, Abbey Mortgage Bank Plc , a prominent primary mortgage institution in Nigeria recorded the highest price loss, dropping from ₦7.63 to ₦5.58, a 26.87% decline; Legend Internet Plc fell from ₦7.60 to ₦6.16, representing a 18.95% drop; while Industrial and Medical Gases Nigeria Plc decreased from ₦39.85 to ₦33.65, down by 15.56%. Nigerian Enamelware Plc declined from ₦25.30 to ₦20.55, a loss of 18.77%; just as Multiverse Mining and Exploration Plc fell from ₦9.00 to ₦7.60, shedding 15.56%.
Outlook:
The late-week pullback signals caution among investor, amid the macroeconomic uncertainty and weak oil market signals. However, the positive breadth and sector-specific strength (especially in Consumer Goods and Pension-linked stocks) indicate an underlying bullish sentiment.
Trending in the Economy: Nigeria’s remittances via International Money Transfer Organisations rose by 44.5% to $4.76bn in 2024, up from $3.3bn in 2023, driven by the reforms undertaken by the Central Bank of Nigeria under Governor Olayemi Cardoso. Key changes include removing FX rate caps, tightening the licensing regime, and expanding market access. July and August of that year accounted for nearly 25% of inflows, with most months showing strong year-on-year growth, while signaling improved FX supply and remittance efficiency.
The Nigerian Government launched a ₦45,000 monthly grant for technical college students to revive the Technical & Vocational Education Tertiary sector and enhancing increased youth participation. As announced by the country’s National Board for Technical Education’s Prof. Idris Bugaje, the ₦120bn the Nigerian Education Loan Fund-backed initiative also covers tuition and training. A proposed bill will establish a National Skills Fund to sustain the effort, alongside curriculum reforms and a China-backed skills program.
Global Market and Oil: Global equity markets ended lower on Friday but closed out the week and month with solid gains—marking the biggest monthly advance since November 2023. Markets fluctuated throughout the week as investor optimism surrounding artificial intelligence and easing U.S.-EU trade tensions was offset by renewed fears over tariff policies and falling oil prices.
Early in the week, sentiment improved after President Donald Trump delayed planned tariffs on European imports, signaling a temporary thaw in transatlantic trade tensions. Midweek, enthusiasm surged following strong quarterly earnings from AI chipmaker Nvidia, reinforcing the tech sector’s leadership in market gains. However, momentum wavered after a U.S. Court of International Trade unexpectedly struck down Trump’s “Liberation Day” tariffs. Although an appeals court later reinstated them, the legal tussle triggered fresh uncertainty. The week closed with another twist as Trump accused China of breaching a mutual agreement to roll back restrictions on critical minerals, warning of potentially tougher actions. “Within four days, markets saw a condensed version of what we’ve witnessed all year—the push and pull between AI-driven gains and trade policy headwinds.”
The S&P 500 edged down 0.01% on Friday to 5,911.69, while the Nasdaq Composite fell 0.32% to 19,113.77, dragged by declines in technology, energy, and consumer discretionary sectors. The Dow Jones Industrial Average rose 0.13% to 42,270.07 after reversing early losses. Despite the mixed daily close, all three indexes ended the week and the month in the green, with the S&P 500 and Nasdaq posting their best monthly gains since late 2023.
In Europe, the STOXX 600 index rose 0.14% on Friday and added 4% for May. Asia-Pacific shares outside Japan climbed 0.74% but still finished the week slightly lower; for the month, however, the region posted a nearly 5% gain—its best since September 2024. MSCI’s global index ended Friday down 0.07% at 879.63, yet gained 5.53% in May.
Oil prices came under pressure as investors reacted to signs that OPEC+ may agree to a larger output increase in July. Brent crude settled at $63.90 per barrel, down 0.39%, while U.S. West Texas Intermediate (WTI) fell 0.25% to $60.79. The decline marked a reversal from earlier in the month and reflected growing market skepticism about near-term demand stability. Weaker oil weighed on energy stocks across major indexes and amplified investor caution heading into June.
Economic data in the U.S. showed consumer spending rose modestly in April, while the Fed’s preferred inflation gauge, the Personal Consumption Expenditures (PCE) Price Index, increased 0.1%, in line with forecasts. Federal Reserve Chair Jerome Powell met with Donald Trump on Thursday, though no policy expectations were shared. The Fed reiterated that future decisions would be guided solely by incoming economic data.
In the bond market, the yield on the 10-year U.S. Treasury fell 2.6 basis points to 4.398%, while the 30-year yield nudged up to 4.9254%. The U.S. dollar strengthened against major currencies, gaining ground against both the yen and the euro. The dollar index rose 0.14% to 99.394, although it remained on track for a fifth straight month of losses due to lingering trade-related uncertainties. Gold prices dipped as the stronger dollar reduced demand. Spot gold dropped 0.7% to $3,292.78 an ounce, while U.S. gold futures settled 0.9% lower at $3,315.40.
Despite daily fluctuations, May closed higher for global markets, with technology and AI stocks leading the charge, even as oil and geopolitical risks remained key areas of concern. Even as May in US market close positive for the first time since 1990.
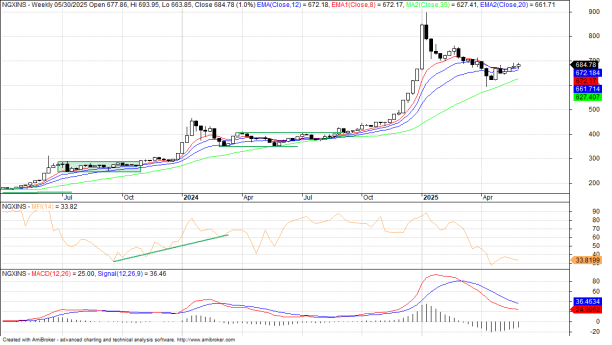
Sectorial Indexes Action & Charts
NGX Banking Index Weekly Chart
NGX Consumer Goods Index Weekly Chart
NGX Insurance Index Weekly Chart
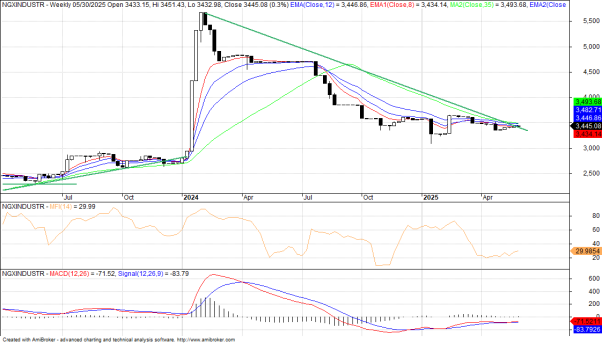
NGX Industrial Goods Index Weekly Chart
NGX 30 Index Weekly Chart
NGX Oil & Gas Index Weekly Chart
