
NGX ASI: Nigeria’s All-Share Index
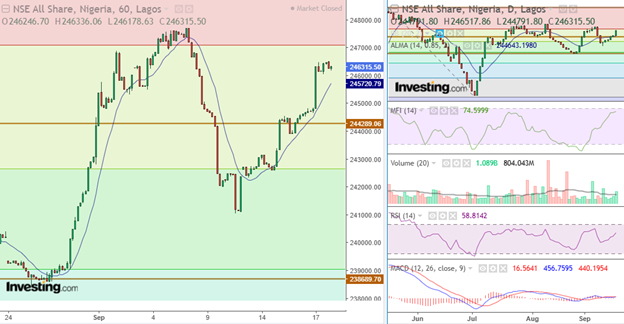
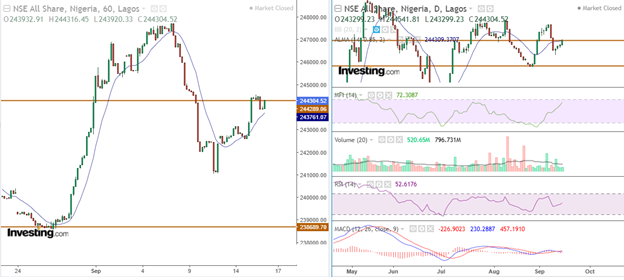
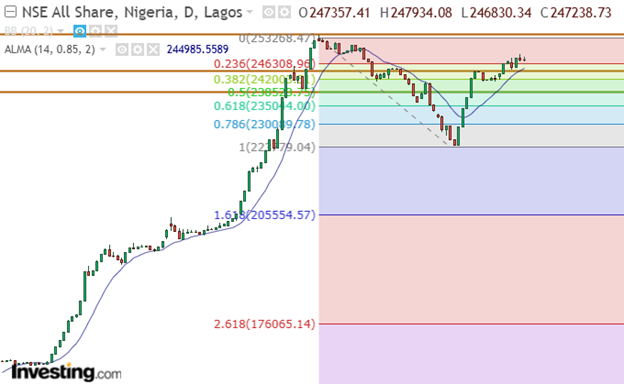
The NGX ASI shed 0.05% and closed at 247,238.73 bps on Monday, as the index remained in its critical zone amid market recovery. A sustained decline would mean a continuous bearish market
Daily chart indicator analysis for NGX ASI
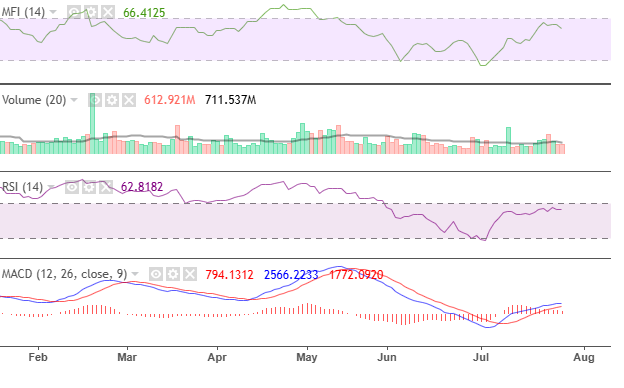
Notably, MACD sustained its decline, suggesting a potential trend reversal. In line with this performance, money flow declined, closing at 66.41. Also, momentum remained solid, closing at 62.81.
NGXBNK: Banking Sector Index
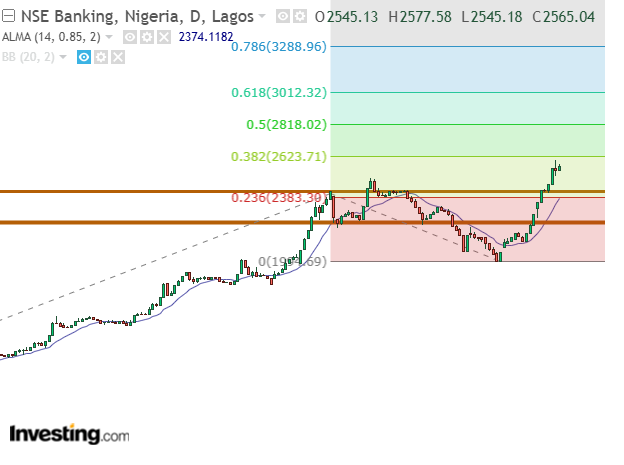
The banking sector index gained 0.78% and closed at 2,565.04 bps. The index closed the previous week with profit-taking. Thus, this week’s action attempts to recover from this bearish momentum. Notable contributors included FIRSTHOLD (+4.32%), UBA (+1.41%), FIDELITY (+3.33%), WEMABANK (+0.31%), and ZENITH (+0.32%).
Daily chart indicator analysis for NGXBNK
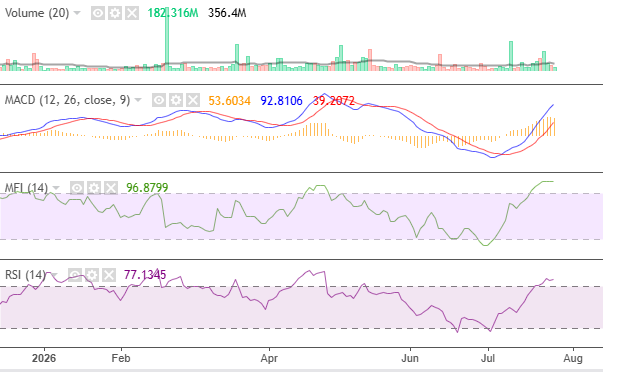
The index’s volume and MACD’s bullish momentum started declining; on the on the on the on the on the on the on the on the on the on the on the other hand, the index’s liquidity and momentum remained strong, signalling a healthy market.
NGXCSMG: Consumer Goods Sector Index
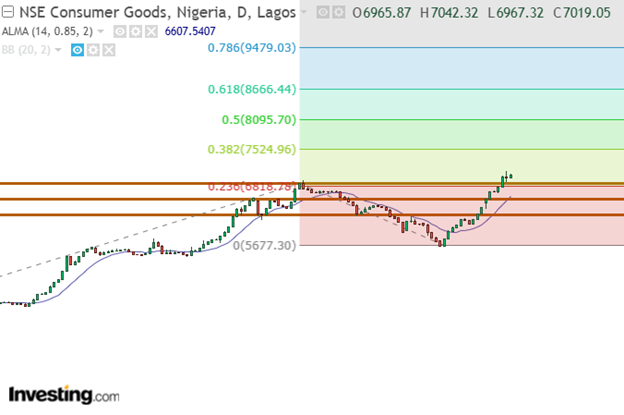
The consumer goods index closed at 7,019.05 bps, gaining 0.76%. During intraday trading, the index attempted to recover from last week’s profit-taking. In line with this sentiment, notable gainers included DANGSUGAR (3.14%), HBMNG (+4.43%), and blue-chip banking stocks
Daily chart indicator analysis for NGXCSMG
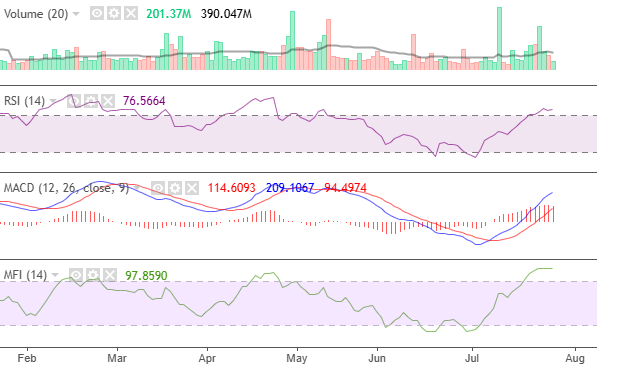
On the daily chart, the index’s volume and MACD’s bullish momentum gradually declined. This performance aligns with the bearish sentiment amid the market recovery, indicating profit-taking. In line with this performance, money flow declined, closing at 53.41. The index’s momentum remained solid, closing at 50.37. Also, MACD sustained its momentum recovery. Thus, if this decline continues, investors should expect a potential bearish momentum.
NGXOGSE: Oil and Gas Sector Index
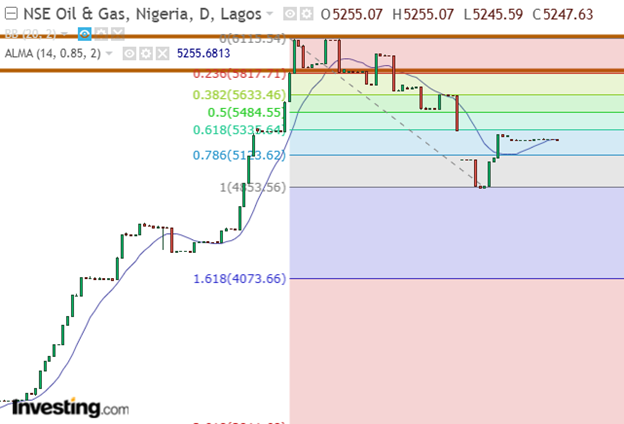
The oil index lost 0.14%, closing below its moving average. Closing at 5,247.63 bps, this performance suggests a continuous corrective market. Investors should watch for potential support at 4,853.56 bps
Daily chart indicator analysis for NGXOGSE
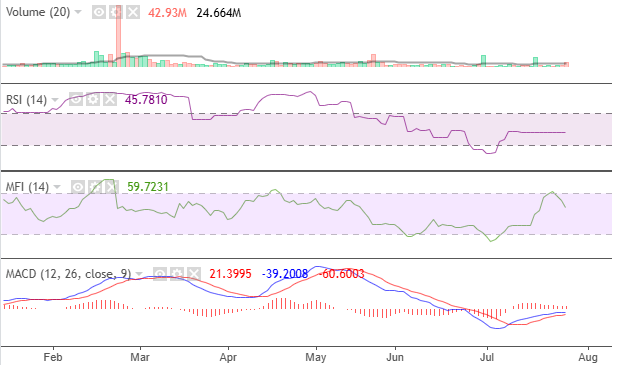
On the daily chart, the index’s bearish volume closed strongly above its moving average, signalling strong profit-taking. In line with this performance, money flow and MACD’s bullish momentum declined.
NGXINS: Insurance Sector Index
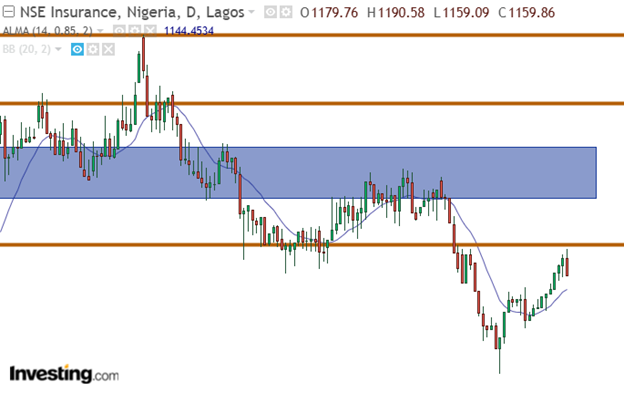
The insurance sector lost 1.69% and closed at 1,159.86 bps. During intraday trading, the index experienced decent bullish momentum and met strong resistance at 1,190.58 bps.
Daily chart indicator analysis for NGXINS
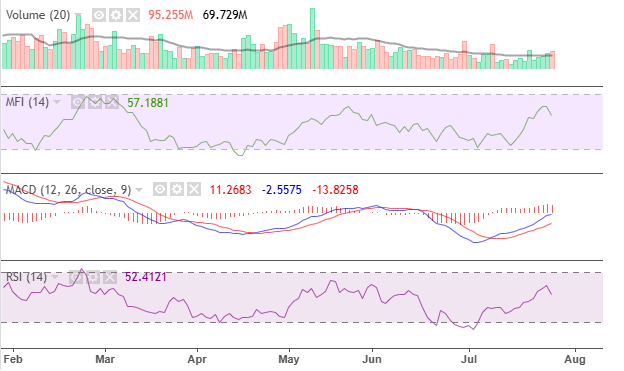
Following the bearish sentiment, volume closed strongly above its moving average. This performance signals profit-taking. In line with this performance, MACD’s bullish momentum, money flow, and RSI declined.