

Quarter Under Preview: 9-MONTHS 2026
Current Share Price: N194.00
Latest Final Dividend: N3.00
Latest Interim Dividend: Nil
Estimated Beta Value: 0.87x
Estimated Fair Value: N135.99
Analyst: Jeariogbe Tunde Segun
The Company
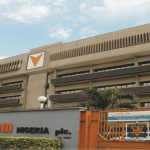
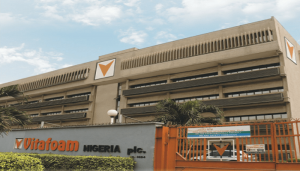
Vitafoam Nigeria Plc was incorporated in 1962 and commenced operations in 1963, making it one of Nigeria’s long-established manufacturing companies. The company was established primarily to manufacture flexible polyurethane foam products, at a time when Nigeria was developing its industrial base and encouraging local production. Over the years, Vitafoam expanded its product range beyond conventional foam to serve the furniture, bedding, automotive, construction and other industrial sectors.
Following decades of expansion, Vitafoam developed into a diversified foam and polymer-products manufacturing group with operations and subsidiaries covering different areas of the market. Its products have included mattresses, pillows, cushions, furniture components, rigid foam products and other polyurethane-based materials. The company also expanded its market reach through distribution networks and strategic investments, while responding to changing consumer preferences and developments in Nigeria’s housing, furniture and construction industries.
Vitafoam Nigeria Plc has been quoted on the Nigerian Stock Exchange (now Nigerian Exchange Limited) since 1978, giving it a long history within Nigeria’s organised capital market. Its evolution from a single-product foam manufacturer into a diversified manufacturing group reflects the broader development of Nigeria’s consumer and industrial economy. Today, Vitafoam remains associated with the production and marketing of foam and related products, with its historical performance shaped by factors such as consumer demand, inflation, exchange-rate movements, raw-material costs, energy expenses and the general operating environment in Nigeria.
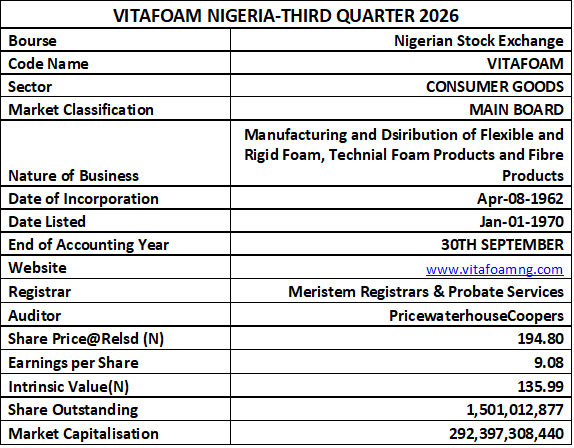
Statement of Comprehensive Income
Vitafoam Nigeria Plc recorded a 7.47% increase in turnover, rising from ₦84.87 billion in Q3 2025 to ₦91.21 billion in Q3 2026. Cost of sales increased by a relatively lower 3.61%, from ₦56.03 billion to ₦58.05 billion, indicating an improvement in gross operating efficiency. Consequently, operating profit rose significantly by 17.26%, from ₦18.48 billion to ₦21.67 billion, despite operating expenses increasing by 15.33% to ₦13.02 billion. Depreciation also increased moderately by 7.90% to ₦867.81 million.
A major positive feature of the period was the substantial reduction in financing pressure. Finance cost declined by 72.42%, from ₦4.87 billion in Q3 2025 to ₦1.34 billion in Q3 2026. Similarly, net finance expense reduced from ₦4.66 billion to ₦915.13 million, representing an 80.35% improvement. This contributed strongly to the 50.15% growth in profit before tax from ₦13.82 billion to ₦20.76 billion. However, tax expense rose by 60.12%, from ₦4.45 billion to ₦7.13 billion, partly moderating the growth in profit after tax.
Despite the higher tax charge, profit after tax increased by 45.42%, from ₦9.37 billion in Q3 2025 to ₦13.63 billion in Q3 2026, while total comprehensive income rose by 36.45%, from ₦9.13 billion to ₦12.45 billion. The PAT margin consequently improved from approximately 11.05% to 14.95%, while the operating profit margin increased from 21.78% to 23.76%. Overall, the Q3 2026 results show stronger profitability and significantly lower financing costs, although the faster growth in operating expenses and tax expense remain areas that require monitoring.
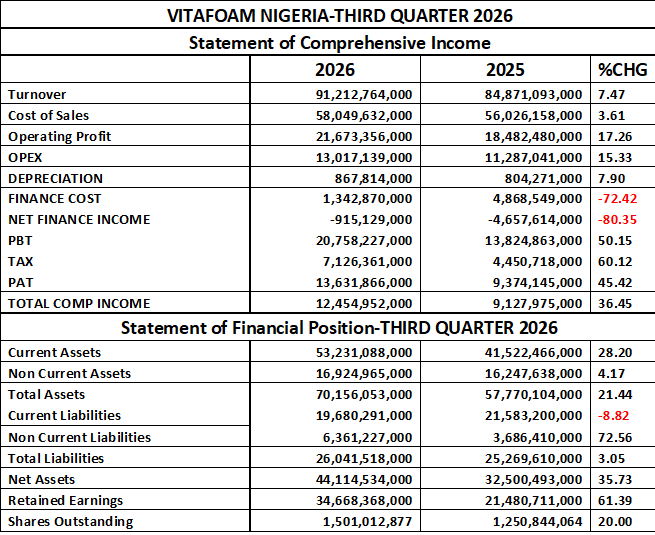
Statement of Financial Position
The Statement of Financial Position for Vitafoam Nigeria Plc at Q3 2026 shows a significant expansion in the company’s asset base. Current assets increased by 28.20%, from ₦41.52 billion in Q3 2025 to ₦53.23 billion, while non-current assets rose moderately by 4.17% to ₦16.92 billion. Consequently, total assets increased by 21.44%, from ₦57.77 billion to ₦70.16 billion. On the liabilities side, current liabilities declined by 8.82% to ₦19.68 billion, although non-current liabilities increased substantially by 72.56%, from ₦3.69 billion to ₦6.36 billion. Overall, total liabilities rose only 3.05%, from ₦25.27 billion to ₦26.04 billion, indicating that asset growth significantly outpaced the increase in total liabilities.
The company’s net assets strengthened by 35.73%, rising from ₦32.50 billion in Q3 2025 to ₦44.11 billion in Q3 2026. Retained earnings also recorded a strong 61.39% increase, from ₦21.48 billion to ₦34.67 billion, reflecting the accumulation of earnings within the business. However, shares outstanding increased by 20.00%, from 1.251 billion to 1.501 billion shares. Overall, the balance sheet reflects strong growth in assets and net assets, lower current liabilities and substantial growth in retained earnings.
Financial Strength/Solvency Ratio
Vitafoam Nigeria Plc’s financial strength and solvency position improved in Q3 2026, with the debt ratio declining by 15.14% from 43.74% in Q3 2025 to 37.12%, indicating a lower proportion of assets financed by debt. Similarly, the Total Debt-to-Equity ratio fell by 24.08%, from 0.78x to 0.59x, suggesting reduced financial leverage and a stronger equity cushion. In line with this, the equity ratio increased by 11.77%, from 56.26% to 62.88%, meaning shareholders’ funds now finance a larger proportion of the company’s assets. The company’s beta of 0.87 indicates that its historical share-price volatility was below the broader market benchmark (assuming a market beta of 1.0). Overall, the ratios point to improved balance-sheet strength, lower leverage and enhanced solvency in Q3 2026.

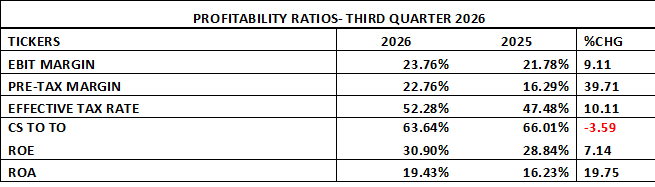
Profitability Ratios
Vitafoam Nigeria Plc recorded an improvement in most of its profitability indicators in Q3 2026. The EBIT margin increased from 21.78% in Q3 2025 to 23.76%, representing a 9.11% improvement, while the PBT margin rose substantially from 16.29% to 22.76%, an increase of 39.71%. The effective tax rate, however, increased from 47.48% to 52.28%, indicating that a larger proportion of pre-tax earnings was absorbed by taxation. Meanwhile, the Cost of Sales-to-Turnover ratio declined from 66.01% to 63.64%, an improvement of 3.59%, suggesting better control of production costs relative to revenue.
Returns to shareholders and assets also strengthened during the period. ROE increased from 28.84% in Q3 2025 to 30.90% in Q3 2026, representing a 7.14% improvement, while ROA rose from 16.23% to 19.43%, an increase of 19.75%. The simultaneous improvement in operating margin, PBT margin, ROE and ROA indicates that Vitafoam generated stronger returns from both its operations and capital base during Q3 2026. Overall, the profitability ratios point to improved earnings quality and operating efficiency, although the higher effective tax rate remains a factor moderating the conversion of pre-tax profit into net earnings.
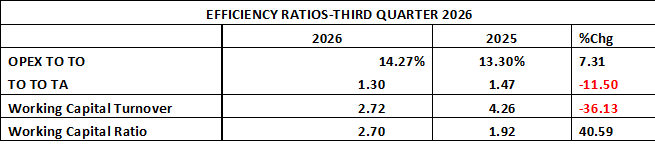
Efficiency Ratio
Vitafoam Nigeria Plc’s efficiency ratios for Q3 2026 present a mixed picture. Operating expenses to turnover (OPEX/TO) increased by 7.31%, from 13.30% in Q3 2025 to 14.27%, indicating that operating costs consumed a larger proportion of revenue. Similarly, turnover-to-total assets (TO/TA) declined by 11.50%, from 1.47x to 1.30x, suggesting a reduction in the efficiency with which the enlarged asset base generated revenue. Working capital turnover also fell significantly by 36.13%, from 4.26x to 2.72x, indicating that working capital generated fewer naira of turnover during the period. However, the working capital ratio improved by 40.59%, from 1.92x to 2.70x, pointing to a stronger short-term liquidity position. Overall, while Vitafoam’s liquidity position improved, the decline in asset and working-capital turnover alongside the rise in OPEX relative to turnover suggests that operational efficiency remains an area requiring attention.
Investment Ratio/Valuation Ratios
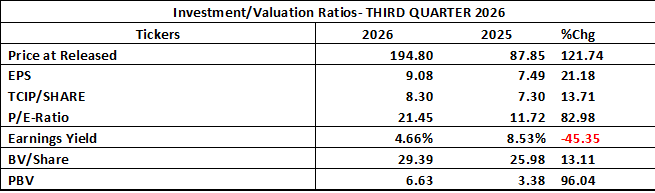
Vitafoam Nigeria Plc’s investment and valuation indicators for Q3 2026 show a substantial re-rating of the company’s shares compared with Q3 2025. The price at release increased by 121.74%, from ₦87.85 to ₦194.80, while EPS rose by 21.18%, from ₦7.49 to ₦9.08. TCIP per share also improved by 13.71%, from ₦7.30 to ₦8.30, while book value per share increased by 13.11%, from ₦25.98 to ₦29.39. These figures indicate that the growth in the market price substantially exceeded the growth in the company’s underlying earnings and book value per share.
The stronger share price, however, has resulted in a significant expansion in valuation multiples. The P/E ratio increased from 11.72x to 21.45x, representing an 82.98% rise, while price-to-book value (PBV) increased from 3.38x to 6.63x, a 96.04% increase. Conversely, earnings yield declined from 8.53% to 4.66%, representing a 45.35% reduction. Thus, although Vitafoam delivered improved earnings and book value, the market price has risen considerably faster, making the shares substantially more highly valued on both earnings and book-value measures.
Full Year Expectations/Projection
Based on Vitafoam Nigeria Plc’s Q3 2026 results, we projected the full-year performance using the company’s Q3 run-rate, while also allowing for the possibility that Q4 follows the stronger earnings pattern seen above.
The company reported ₦91.21bn turnover and ₦13.63bn PAT for nine months, compared with ₦84.87bn and ₦9.37bn respectively in the corresponding period. If the nine-month performance is simply annualized, FY2026 turnover would be about ₦121.62bn, PBT about ₦27.68bn, and PAT about ₦18.18bn. This would translate to approximately ₦12.11 EPS, based on the current 1.501bn shares outstanding. However, a more optimistic scenario is possible if Q4 earnings grow at roughly the same rate as the first nine months: FY2025 Q4 PAT was about ₦5.16bn, and applying the 45.42% nine-month PAT growth would produce Q4 2026 PAT of about ₦7.51bn, giving projected FY2026 PAT of approximately ₦21.14bn and EPS of about ₦14.08.
The ₦3.00 dividend paid/recommended for FY2025 represented about 25.8% of the FY2025 EPS on the old share base. If Vitafoam maintains a similar payout discipline in FY2026, the base dividend expectation would be around ₦3.60 per share, with a reasonable range of ₦3.50–₦3.70. At the Q3 release price of ₦194.80, a ₦3.60 dividend would imply a prospective dividend yield of only about 1.85%, so the investment case would depend considerably more on earnings growth and potential capital appreciation than on dividend income. The key issue to watch in Q4 is whether the strong improvement in profitability—particularly the sharp reduction in finance costs—can be sustained.
Final Verdict on Vitafoam Plc
Vitafoam’s Q3 2026 performance is fundamentally stronger than the corresponding period of 2025. Revenue grew 7.47%, PBT increased 50.15%, while PAT rose 45.42%. Profit margins, ROE and ROA improved, and the company’s leverage position strengthened, with the debt-to-equity ratio falling from 0.78x to 0.59x. The projected FY2026 PAT of about ₦20–21 billion and EPS of approximately ₦13.50–₦14.10 suggest continued earnings growth, with a possible dividend around ₦3.50–₦3.70 compared with ₦3.00 last year.
However, the major concern is valuation. At about ₦194.80, the share price has risen 121.74%, far ahead of the 21.18% EPS growth. Consequently, P/E expanded from 11.72x to 21.45x, while P/B rose from 3.38x to 6.63x and earnings yield declined to 4.66%. Therefore, the strong operating performance is already accompanied by a substantially higher market valuation. The fundamentals support continued monitoring and holding, but the elevated valuation reduces the margin of safety for fresh entry at the current price.