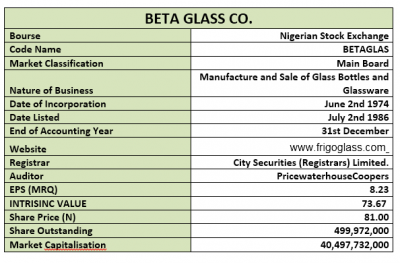
Company: Beta Glass Plc (BETAGLAS)
Rating: Hold
Current Market Price at Earnings Release: N81.00
Intrinsic Value: N73.67
Latest Cash Div: N1.07
By: Jeariogbe Tunde Segun (Equity Analyst)
Key Financial Tickers
• This report observed both the full year financial performance indices of Beta Glass Plc (BETAGLAS) for the year ended December 2017 and the first quarter 2018 statistics.
• Beta Glass Plc manufactures, distributes and sells glass bottles and containers for the packaging soft drinks, wine and spirit, pharmaceutical and cosmetics. The company has manufacturing plants in Agbara, Ogun state, and Ughelli, Delta state. It exports to three countries: Ghana, Guinea, and Cameroon and is a subsidiary of Frigoglass Industries Nigeria Limited (the parent company) which holds 61.9% of its ordinary shares.
• Finance cost galloped between the two years under comparison. Recall that N19.808 million was reported in the previous year as finance cost, meanwhile, an amount that rose to N126.261 million at the end of 2017 financial year.
• The company recorded lower Fx gain of N244.119 million, a significant decline from the N1.913 billion realized in the corresponding period of 2016.
• Finance costs comprise interest expenses on borrowings. Effective June 2016 the company’s Tranche 2 bond was restructured to enable half-yearly liquidation of principal, while interest was renegotiated to 15.75% per annum.
Corporate Figures
• Turnover reported for the year ended 31st December, 2017 improved by 16.21% from the comparable year to N22.186 billion, as against the N19.091 billion reported in 2016.
• Impacted by adjusted Operating Expenses, Operating Profit grew by 47.92%, moving from N2.957 billion to the current N4.375 billion
• Profit before Tax rose by 12.26% at N5.854 as against the N5.215 billion reported in 2016
• Profit after Tax was N4.115 billion, 8.31% above the N3.799 billion of the previous year
• Retained Earnings on the other hand improved to N22.152 billion as against N18.482 billion in 2016
• Total Assets stood at N38.211 billion, rising by 15.13% from the N33.190 billion last year.
• Pushed by Current Liabilities (please note that Non-Current Liabilities dropped by 14.73% as against the previous year). Total Liabilities rose above comparable year’s figure by 11.52%.
• Net Assets was currently valued at N25.145 billion, a 17.09% 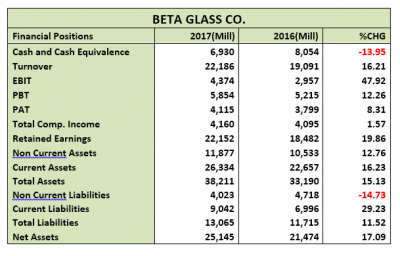 improvement above the previous year value
Liquidity/Risk Ratios
• Debt to Equity ratio is only 2.02%. This is 96.93% below the industry average and shows how highly liquid the company is.
• Meanwhile, estimated current ratio is above unity at 2.99x as against the industry average of 1.61x. The theoretical implication of this is that the company will be able to swiftly service its current liabilities as at when due
• Meanwhile, at negative beta value of -0.15 Beta Glass is far less patronized by the investing public, although this is typical of industry peers, Beta Glass’ case is such that it may spend days without recording any trade on the NSE.

Profitability Ratios
• Cost of Sales Margin is currently estimated at 76.35%, slightly below the 79.33% estimated last year.
• Profit before Tax margin is same as 26.39%, this is 3.40% below the 27.32% estimated from 2016 financials
• The amount reported as Profit for the period is 6.80% below the previous year’s margin.
• Return on Average equity is currently estimated at 16.37% compared to the 17.69% estimated in 2016.
• Return achieved on Average Assets is now 10.77%, as against the previous 11.45%

Efficiency Ratios
• Testing the management’s efficiency, when Asset Turnover was gauged, the Ratio improved marginally by 0.94% from 57.52% to 58.06%.
• Also tested was the Equity Turnover, which currently stand at 88.23%, as against the 88.90% estimated in 2016.
• In other words, the equity was multiplied 1.52 times through the 2017 financial activities slightly below the 1.55 times in 2016.
• See the table below for further efficiency ratios.

Investment Ratios
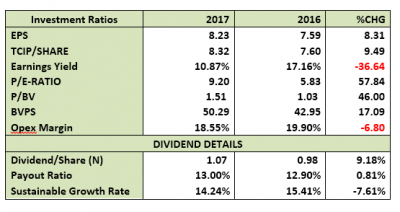
• Estimated Earnings per shares for the year is N8.23, this is 8.31% improvement above the N7.59 estimated from last year result
• Price Earnings ratio (PE/Ratio) confirmed marginal investors’ preference for Beta Glass Plc share as it moved from 5.83x to 9.20x
• Two ratios that confirm the overpriced position of each unit of Beta Glass on the floor of the Exchange are: Price to Book Value (P/BV) and the Book Value (BV). P/BV at more than one (1) implies that each share is theoretically overpriced. Confirming this further is the estimated BV of N50.29, far above the market price of N81.00
First Quarter 2018 Financial Indices
• In the first three months of 2018, all the income statement improved over the corresponding period of 2017 are as follows:
Turnover figure improved by 44.96% to N6.438 billion, from the ₦4.441 billion of Q1 2017.
Profit before Tax outstandingly galloped over that of 2017, moving from N1.177 billion to N1.677 billion
Similarly, Profit after Tax moved from N800.309 million to N1.140 billion
• Total Assets grew by 21.29% from N32.771 billion to N39.750 billion.
• Total Liability rose against corresponding year by 28.28% to N13.464 billion from N10.496 billion.
• Net Assets was N26.285 billion, which is 18% above the previous N22.275 billion.
• On the strength of the above mentioned
Earnings per share for the reported three months is estimated at N2.28 compared to the N1.60 earned in Q1-2017
The said earnings is a yield of 3.02% over the current market price as at the released of the financials
Book Value increased to N52.57 above the N44.55 achieved at the end of Q1-2017
Valuation
• Our blend of valuation model carefully priced each units of Beta Glass share at N73.67.


