


Fidson Healthcare Plc was incorporated in 1995 and commenced business in the same year as an importer/distributor of pharmaceutical products. Today, its principal business is the manufacturing and distribution of pharmaceutical products. Fidson was listed on the Nigerian Stock Exchange (now Nigerian Exchange) in 2008.
Current price: ₦98.10
Rating: Buy
Price projection: ₦119, ₦130, and ₦160
Technical Analysis
In this report, we shall use the following tools and analysis methods:
Elliott’s wave theory to understand the overall market sentiment
Fibonacci tools to determine support and resistance levels
The Relative Strength Index and volume to evaluate the market’s strength
The Money Flow Index to determine the market liquidity
Moving average and MACD to understand the nature of the trend
Top-down analysis to know the best investment position
Elliott wave analysis
Weekly chart: Market overview
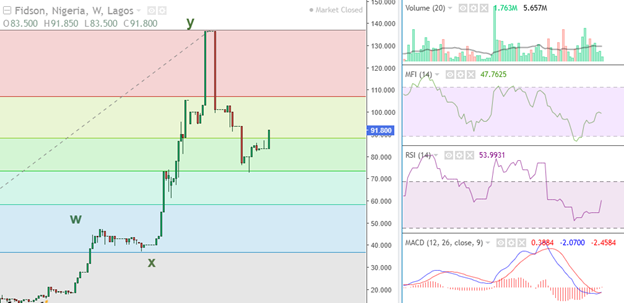
On September 25, Fidson’s technical analysis reported that stock commenced its recovery within the 0.5 Fibonacci level. In line with this performance, the stock consolidated in October and commenced its strong bullish signal in November. In line with this performance, MACD initaited its bullish signal, attracting investment opportunities. The stock’s volume, liquidity, and momentum also remained solid, aligning with the overall market sentiment.
Daily chart: Investment opportunity
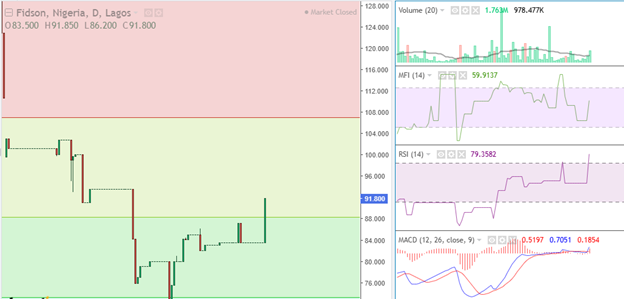
On the daily chart, the stock gained 9.94% using ₦83.50 as a strong support level. In line with this performance, its liquidity, volume, and relative strength improved exponentially. Also, MACD launched its bullish signal, aligning with the weekly chart. Investors should watch ₦119, ₦130, and ₦160 as potential resistance levels.