Market Roundup for June 2021
Wednesday, the last trading session of the month, quarter and half-year closed positively on renewed buying interests and positive sentiments after pullbacks and corrections, as players took profits and sold off positions to realign their portfolios, due to the changing price patterns and trading environment. At the same time, the market created opportunities for discerning investors and traders to buy low and sell high.
This year 2021, value and growth stocks have shown strength, especially some of them that were battered during the pandemic last year which made the highly priced stocks to beat the market index (NGXASI). After nearly 95% rally off the March 2020 lows, it is no surprise, therefore, that the market is having a mix trend of oscillation and trending sideways year-to-date.
Technically, year-to-date, the NGX Index action and many stocks are in their value area of resistance and support, waiting for a breakout or breakdown in the second half of the year 2021, depending on market forces. This is a function of demand and supply, sentiments, and earnings which are the engine that drive prices on the short to long-run.
That notwithstanding, some stocks have recorded huge gains year-to-date and most of you in Investdata buy & sell signal and those at the Q2 master class have benefited from. In any equity market across the globe, superior fundamentals define leading stocks and earnings rebound has sharp influence on company share prices, especially when positive uptrend in earnings are sustained or established. Also, technically, the best of stocks distinguish themselves with sound base chart patterns.
Profit taking is inevitable in stock trading, so taking profit at 12% to 15%, rather than the normal 20% to 25% may be a useful strategy in the second-half of this year to avoid being trapped in any position for too long. In the next six months, the small and medium cap stocks are set to outperform the high and large cap equities as most of the highly priced stocks are overpriced and overweighted.
Despite the down market in June, every investment or trade is against expectations, let your investment objectives guild your entry and exit decisions, since the beginning of the year 2021. We note that the nation’s equity market has been oscillating as a result of many factors ranging from rising inflation regardless of slowing down in the last two months, rising yields in the fixed income space, recovering oil price in the international market as it now trades above $73 per barrel. This is not minding that the increase is not reflecting on the nation’s foreign reserves, just as other factors such as the improving earnings during recession and post-recession, relatively higher dividend payout, weak and mixed macroeconomic indices and security challenges.
During the month of June, the NGX recorded 21 trading sessions of which the market was up in 12, and down in nine sessions, following which the NGX All-Share index closed lower for the month on a mixed trend. The key performance index lost 530.65 basis points for the month, closing at 37,907.28bp after breaking down the psychological line of 38,000 to touch the month’s low of 37,555.30bps, from its highs of 39,262.71bp, after it had opened at 38,437.88bp which represented 1.38% decline for the month.
The sentiment report for June revealed buying position of 21% and selling volume of 79%, as total transactions volume index stood at 0.67 to extend the previous month’s losing position, while market capitalisation lost N281bn, closing at N19.76tr from an opening value of N20.04tr, representing 1.39% loss also. The market had a combination of mixed sentiments, selloffs and profit taking as weak macro-economic data released dampened investor confidence. The month’s traded volume was down slightly by 0.22% at 4.53bn shares, from 4.54bn units in the previous month.
The composite index’s year-to-date loss position stood at 5.87%, just as market capitalisation decline stood at N1.30tr, representing 6.16% loss YTD from the opening value.
The market breathe in the month of June was slightly positive as gainers outpaced losers in the ratio of 44:41, despite extending the bearish situation in the month of May, reflecting the selloffs in high cap stocks, price adjustment for dividend, profit booking in medium and low priced equities.
Performance indexes across the sectors and market were up as shown in the chart below, except the NGX Insurance that was down for the month by 0.77%, whereas the NGX Consumer goods, NGX 50, Pension, Banking, Premium, Industrial goods and Energy outperformed the key performance index as more stocks recorded gain for the period, while losses suffered by highly capitalized stocks dragged theNGX index action down for the period under review.
These was attributed to price adjustments for dividend during the period, selloffs and profit taking in stocks BUA Cement, Airtel Africa, Stanbic IBTC, Presco, UACN, CAP and BOC Gas among others, as discerning investors rethink and position early ahead of the half-year earnings reporting season, amidst the relatively low Price-To-Earnings attraction in the market. See the table below for more

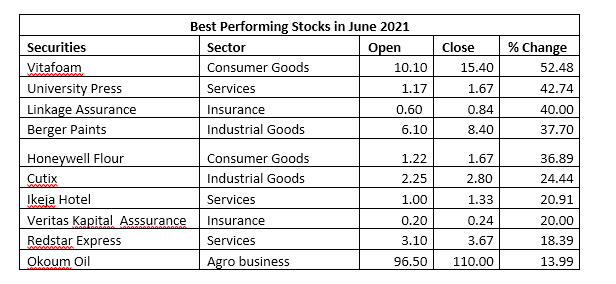
Best Performing Stocks for June
Medium and low priced stocks dominated the advancers table for the period under review, especially manufacturing companies ranked the best performers, as Vitafoam, Berger Paints, Honeywell, Cutix and Okomu Oil, signaling recovery in the sector, on improved earnings emanating from these companies that support their share prices. Recall that the sector had been battered before now, while the market still look forward to better quarterly numbers from these companies. The stocks closed the month higher as indicated in the table below.

Worst Performing Stocks for June
The top losers in the month were high priced stocks and small cap companies, led by Computer warehouse group, which shed 44.44%, on the back of poor earnings and selloffs, followed by Royal Exchange Assurance as traders took profit from the company recent price rally. BOC Gases and Airtel Africa witnessed selloffs as investors realigned their portfolio for high dividend yields and payout with earnings around the corner. The case of Consolidated Hallmark Insurance is purely profit taking, considering the company’s impressive numbers, while that of Japaul Gold seems to be investors reacting to the company’s disappointing numbers after initial hope from the previous earnings report. CAP declined by 14.41%; FTN Cocoa, 13.16%; and Stanbic IBTC, 12.25% on the back of price adjustment for bonus shares.

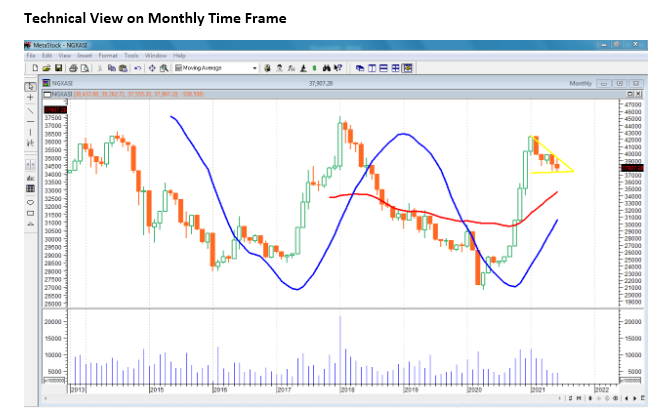
Technical View on Monthly Time Frame

The NGX index action has formed a descending triangle on a monthly chart, which suggests a breakout or down from now, as candlestick formation is not giving clear direction after it had suffered decline consecutively for two months, ahead of major financial news in form of earnings. The state of the expected numbers may trigger buying interests and positive sentiments for portfolio adjustment and repositioning for Q2 numbers are likely to continue. The inflow to equity assets on a monthly time frame as revealed by money flow index may support the seeming reversal on smart money reposition their portfolios.
NGX Index action On A Weekly Time Frame

The NGX index action on a weekly chart is still trading above the 50-day moving average after forming a descending triangle and rectangle channel of resistance and support level of a trendy market. But the double bottom formed within the channel supports strong reversal if the expected numbers beat expectations. A reversal at this point will add more momentum to the recovery move of the entire market and the possibility of touching 40,000 to 42,000 is high.
NGX Index Action On Daily Chart

NGX Index action on a daily time frame had confirmed a new uptrend with the strong rebound recorded at the last trading session of June to usher in second half of the year, putting the short term support level at 37,555.30. this rebound is very important as index action resisted further decline and hold the double zigzag and bottom pattern with impulsive wave that supports uptrend just as discussed in our Q & A session over the weekend. As momentum indicators are looking up including money inflow index to reveal that funds entering the market ahead of Q2 earnings reports.
INVESTDATA 2021Q3 MASTERCLASS
Theme: Road Map For Improved Trading Results Enhanced Confidence
Sub-Topics
- Building Wealth with Diversified Portfolios In Amidst Economic Recovery, Stagflation Alhaji KurfiGarba MD/CEO Apt Securities & Funds Ltd
- Combining Technical Indicators & Tools With Higher Time Frame To Initiate, Manage Trades Mr Abdul-Rasheed OshomaMomoh, Head Capital Market at TRW Stockbrokers Ltd
- Volume Factors That Give Profitable Signals in Any Market Phase, or Cycle, Mr Ambrose Omordion, Chief Research Officer, Investdata Consulting Ltd
Based on the changing market dynamics and trading environment, Investdata Master class will show you how to effectively combine fundamental and technical tools to read and analyses simultaneously for a true insight into market actions and direction.
This Master Class will cover
- Selecting portfolios that beat inflation in a recovery economy
- How to read the higher and trading time frame bars for a true trading edge.
- Knowing the factor that fuel stock market trading and how its impact your portfolio.
- Entry and exit technique that get you in and out at good prices and add to your bottom line.
- Improve your chances of entering wining trades, using volume factor and analysis to see what the market is doing more clearly and with a greater degree of confidence.
- 5 Hot inflation beating stocks
- Q3 trade ideas and sectorial indexes charting
Trading the equity market on minutes and day charts can be challenging, because things or events happen so fast. Volatility occurs first on the daily time frame, often with little or no warning.
Momentum indicators like RSI, MACD and moving average are useful, but most times they give false signals, making many traders miss opportunities and solid trades. But for you to pinpoint a winning trade and where smart money is moving with more accuracy, you need volume analysis and sentiment reports.
Date: July 3, 2021
Time: 9am prompt
Venue: ZOOM.
Fee: N 50,000
However, with less than 28 days to the beginning of Q3 2021, you need a road map to navigate the quarter profitably with confidence. Don’t miss this opportunity as we countdown to July 3, 2021 for this Master Class.
During this practical session, our team of experts will reveal practical trade ideas and opportunities that you can apply or implement immediately in Q3 2021 to consolidate your gains, maximize returns and start tracking the result by yourself.
If it is your desire to be among smart investors and traders in Q3, send Yes to: the phone numbers below now.
Meanwhile, the home study packs on Comprehensive Stock Market trading course video, INVEST 2021 New Opportunities & New Paths To Profits Summit materials and 10 Golden Stocks for 2021, Strategies and How to invest profitably in this Changing Market Dynamics/ Recession, Mastering Earnings Season For Profitable Investing and Trading in any market situation/ cycles, Life Beyond COVID 19 Investment Opportunities In The Stock Market are now available. To obtain your pack send ‘Yes’ or ‘Stock’ to 08028164085, 08179547605, 08111811223 now.
Ambrose Omordion
CRO|Investdata Consulting Ltd
ambrose.o@investdataonline.com
Tel: 08028164085, 08179547605


