
Company: Red Star Express Plc
Rating: Hold
Current Market Price: N4.95
Year High: N5.50
Year Low: N4.20
Fair Value: N4.89
Equity Analyst: Tunde Segun Jeariogbe
Key Investment Ratios
• In this report, we have observed the full-year financial statistic of Red Star Express for the year ended 31st March 2019. In other to effectively rate the result, we have compared the same with a similar result in 2018
• Our valuation technique also utilizes Free Cash Flow for Equity (Stable Growth). Thus, we have conservatively valued each unit of Red Star Express at N4.89, this is within its market trading range for the past three years. In other words, the market seems to have rightly placed the stock over the years.
• In our opinion, the outstanding performance of the company will definitely attract a higher valuation by the investing public.
• Please understand that for the current financial year being analysed, the management announced a 43 kobo cash dividend, for which its books are scheduled to close between July 17 and 19, 2019, following which the qualification date is July 16, 2019.
• See below for a comparison of released figures/our opinions

Company figures
• Turnover for the year stood above comparable year of 2018 by 19.73%, having moved from the previous N8.40 billion to N10.05 billion.
• Cost of Sales equally increased by 29.60% to N7.29 billion, compared to N5.62 billon posted at the end of 2018 financial year.
• Operating Profit is estimated at N764.58 million, same as 24.54% above the N613.93 million in 2018.
• Meanwhile, Operating Expenses was constrained, rising by just 2.79% over the 2018 level to N2.25 billion, as against N2.18 billion.
• Finance Cost improved to N33.90 million from N27.66 million in 2018.
• Profit before Taxation was therefore estimated at N743.46 million, same as 21.76% above the comparable year estimate.
• Having Considered Tax expenses of N277.22 million, the management of Red Star posted N466.24 million as profit for the year as against the N383.63 million in 2018.
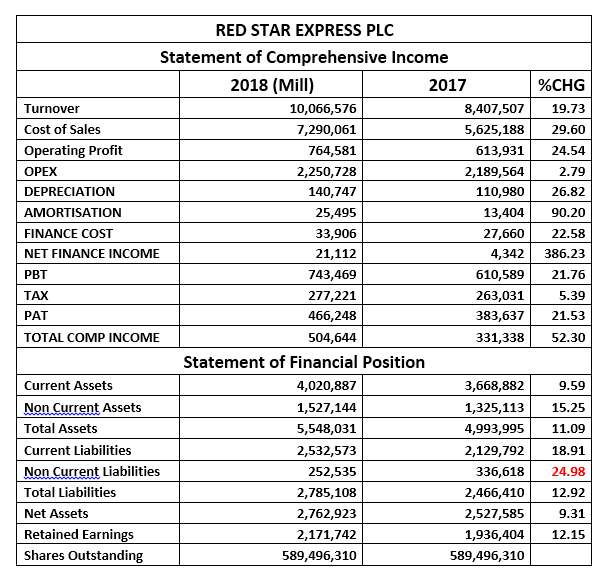
• Current Assets reported at the end of the period stood at N4.02 billion, same as 9.59% over the 3.66 billion of 2018.
• Non-Current Assets equally improved by 15.25% to stand at the current estimate of N1.52 billion as against the N1.32 billion posted in 2018
• Current Liabilities was valued at N2.53 billion as against the N2.12 billion posted at the end of 2018 financial year.
• Non-Current Liabilities dropped by 24.98% to N252.53 million from N336.61 million stated in the 2018 full-year result.
• Net Assets Climbed by 9.31% to N2.76 billion from N2.52 billion.
• Retained Earnings is currently valued at N2.17 billion from N1.93 billion in the corresponding year.
Financial Strength/Solvency Ratios
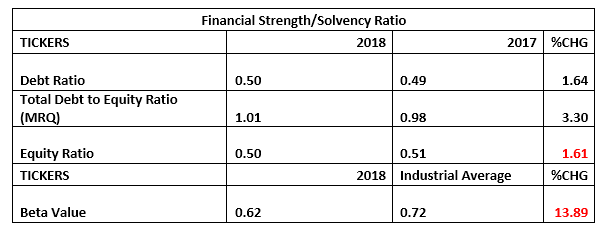
• Debt Ratio is currently estimated at 0.50x, higher than the 0.49x estimated for 2018 full year financials.
• Total Debt to Equity is estimated at 1.01x up from the 0.98x estimated in the comparable quarter.
• We also tested the Equity Ratio and established that Equity is same as 50% of the Total Assets Value stated at the end of the quarter, this is slightly below the 51% ratio estimated from 2018 financial indices
• Beta Value at the time of this report stood below unity at 0.62x, below the industry average of 0.72x.
Profitability Ratios
• EBITDA margin estimated for the year stood at 7.60%, 4.01% above the 7.30% estimated from the corresponding year’s numbers.
• Pre-Tax Margin appreciated by 1.69% to 7.39% against the 7.26% estimated at the end of 2018 financial year.
• Effective Tax Rate adjusted down by 13.28% to 59.46% from 68.56% of 2018.
• Cost of Sales figure posted at the end of the quarter is the same as 72.42% of the Turnover figure, this shows an upward marginal adjustment of 8.24% from the previous estimate of 66.91%.
• Return on Equity stood at 16.88%, against 15.18% in 2018.
• See the below table for details.

Efficiency Ratios
• Operating Expenses is currently estimated to be 22.36% of Total Turnover figure for the year, which is 14.15% below the 26.04% achieved in the corresponding year.
• Meanwhile, turnover is the same as 181.44% of Total Assets figure posted for the year. This is a marginal improvement over 168.35% of the previous financial year
• Working Capital Ratio, a ratio that indicates a company’s effectiveness in using its working capital was estimated at 6.76x against the 5.46x that was estimated in similar 2018.
• Further testing the company efficiency, we checked the Working Capital Ratio, which confirmed that Current Assets is 1.59x higher than current liabilities as against the 1.72x multiple of last year.

Investment/Valuation Ratios
• At the end of its 2019 financial activities, the management of Red Star Express achieved Earnings Per Share improvement of 21.53% from the previously N0.65 to N0.79.
• P/E-Ratio slipped by 37.34% to 6.26x from 9.99x.
• The said Earnings Per Share is a 15.98% yield over the current market price of Red Star Express shares on the floor of the exchange as at the time the result was made available to the investing public.
• We have estimated the Book Value for Red Star Express shares at N4.69 against the previous estimate of N4.29.
• Confirming that each unit of Red Star Express is rightly priced on the floor of the exchange is the Price to Book Value Ratio that is currently estimated below unity at 1.06x.

Valuation
As stated above, our blend of valuation models conservatively valued each unit of Red Star Express Shares for N4.89, this is 2.06% below the current price as at the time this report was compiled. We have therefore rated Red Star Express a Hold.


